Polymarket Tariff Markets 2026: The Court Bet Quietly Climbing to 52 Cents
Deep data analysis of Polymarket's two key tariff markets in 2026: the $497M court refund bet vs. the volatile recession market — and what their divergence reveals.

Two markets. Same subject. Completely different personalities.
Since early January, Polymarket traders have been building up two distinct positions on the US trade war: the recession odds market, which is loud and volatile, swinging from 20 cents to 44.5 cents and back in a matter of weeks — and the court tariff refund market, which has been quietly, methodically marching upward from 16 cents to 52 cents over the same period. As of today, the court bet has accumulated approximately $497 million in cumulative trading volume and sits exactly on the fence at 52.5¢.
That divergence is not random. The two markets are pricing different risks, moving on different information, and the smarter one is probably the quieter one.
We pulled the full price and volume history from both markets using the polymarketdata.co API. Here's what the data actually shows.
The Two Markets
Market 1: "US Recession by End of 2026?" (market ID: 609655)
Opened well before our data starts. This market has over $1.2 billion in cumulative volume — one of Polymarket's largest macro markets — and is currently trading at 30¢. The key question: does the US economy tip into a recession before December 31, 2026?
Market 2: "Will the Court Force Trump to Refund Tariffs?" (market ID: 1126854)
Opened January 7, 2026 as the Court of International Trade began hearing challenges to the administration's use of IEEPA authority for tariffs. The market asks whether courts will compel the executive branch to refund over $130 billion in tariff revenue already collected. It opened with thin volume — just $341K on day one — and has accumulated $497M since. It's now trading at 52.5¢.
Here's the price history for both, from January through today:
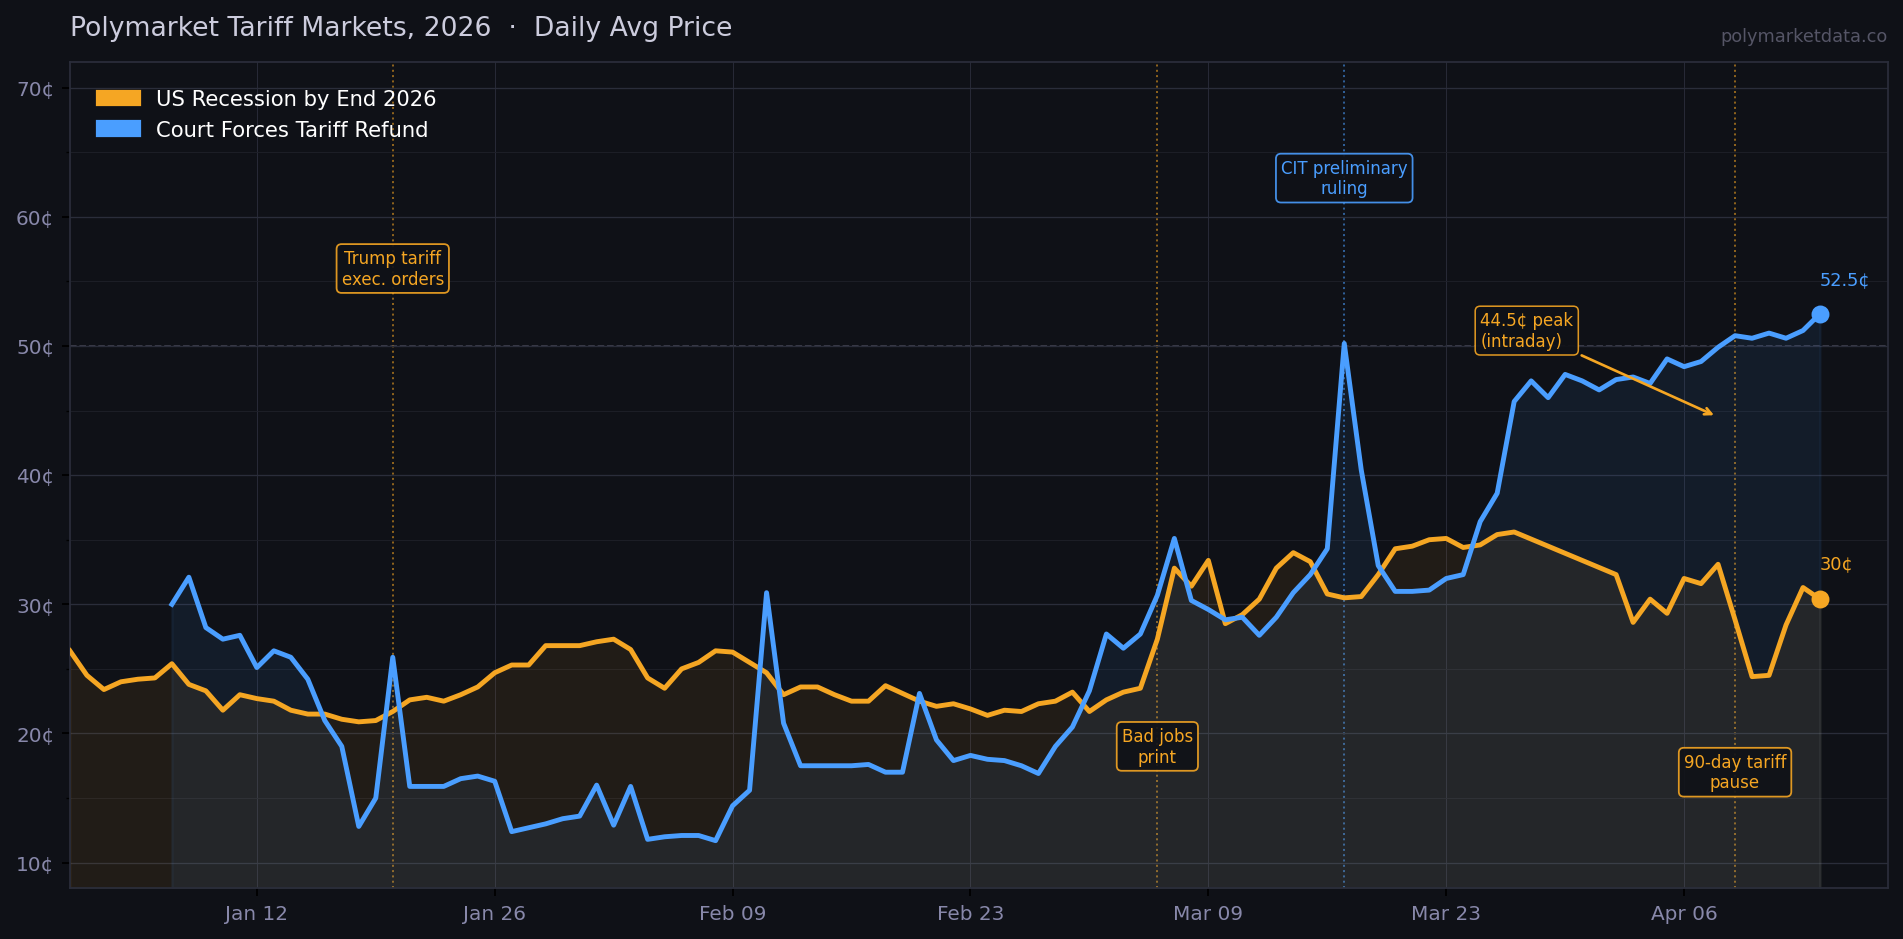
Source: polymarketdata.co. Daily average prices, January 1 – April 14, 2026.
The Recession Market: A Tale of Three Regimes
The recession market has been through three distinct regimes this year.
Regime 1 — The Optimist Phase (January 1–20)
The market opened 2026 at 26¢ and was still drifting lower. Strong Q4 2025 GDP data, falling inflation, and a labor market that still looked healthy gave traders reason to think recession risk was overpriced. By January 15, the Yes token had fallen to 21.5¢ — the lowest reading in the dataset. Then Trump's inauguration on January 20 changed the calculus: tariff executive orders went into effect almost immediately, and the market ticked back up to 21.7¢.
The remarkable thing about January 20 isn't the size of the move — it's the smallness of it. Traders barely flinched. The consensus seemed to be that tariffs would be negotiating tactics, not permanent policy.
That consensus was about to get tested.
Regime 2 — The Repricing (February 1–March 27)
By late February, the recession market had crept back to 22–25¢ as tariff headlines multiplied. The real break came on March 6: the worst US jobs print in three years dropped, and the market jumped from 27¢ to 32¢ in a single day. By late March, it had climbed to 35¢ — a level not seen since the previous October.
This is the "slow repricing" regime: no single explosive move, just methodical buying as the macro picture deteriorated.
Regime 3 — The Explosion and Snap-Back (April 2–14)
Then came the tariff shock. Between April 7 and April 8, the recession market spiked to an intraday high of 44.5¢ as the administration announced sweeping new tariff schedules. Within 36 hours, on April 9, it crashed back to 19.5¢ — the lowest reading since early January — after the White House announced a 90-day tariff pause.
That swing represents a 25 cent move in 36 hours on a market with over a billion dollars of total volume. The market is now settling back around 30¢.
What should you make of this? The recession market is priced primarily by news traders. It reacts fast and violently to headlines, overshoots in both directions, and then mean-reverts. The April 9 crash is a perfect example: the 90-day pause removed one near-term tail risk, but it didn't change the underlying legal and trade dynamics. The market's quick selloff to 19.5¢ looks, in retrospect, like an overreaction — and the bounce back to 30¢ over the next five days confirms it.
The Court Market: Slow, Steady, and Up
The court refund market tells a completely different story.
It opened at 30¢ in early January and immediately sold off — traders were skeptical that courts would actually compel the executive branch to unwind tariffs that were already in force. By January 18, the Yes price had fallen to just 12.8¢. At the time, the conventional wisdom was that IEEPA gave the administration broad authority and that legal challenges would be long, slow, and probably fruitless.
The slow reversal began in mid-February. Volume started building — from the $10–15M/day range in early February to over $100M in late February. Something was changing in how the market assessed legal risk.
The pivotal moment came on March 17, when the court market spiked from 34¢ to 50¢ in a single session — the sharpest single-day move in the market's history. This coincided with signals from the Court of International Trade that a preliminary ruling on IEEPA tariff authority was imminent. The market backed off slightly to 40¢ the next day, then spent two weeks consolidating around 30–33¢ — which, in hindsight, looks like the last opportunity to buy the legal risk cheaply.
From March 25 onward, the court market has been in a one-way trend. It didn't participate in the April 7–8 recession panic. It didn't crash on April 9's tariff pause announcement (while the recession market fell 40%, the court market barely moved, settling at 50.8¢). Since then, it has continued grinding upward to 52.5¢ today.
The court market is not trading news. It's trading a slower-moving but more structural signal: whether the legal architecture of US tariff policy survives judicial scrutiny. That question doesn't change when the White House announces a 90-day pause.
The April 9 Divergence: The Most Informative Day in the Dataset
April 9 is the single most interesting data point in this analysis. On that day:
- The recession market fell from ~33¢ to 19.5¢ (a 40% drop in the Yes price)
- The court refund market rose from 49.9¢ to 50.8¢ (a 0.9¢ increase)
These two markets moved in opposite directions on the same headline. That's not noise — that's the markets telling you something precise:
- Recession risk eased because the tariff pause means less near-term economic damage. Fair.
- Legal risk stayed elevated because the constitutional question — whether IEEPA tariffs were legally authorized in the first place — is unaffected by administrative policy pauses. A court can still rule that the tariffs were invalid, and if it does, refunds are on the table regardless of whether tariffs are currently active.
The recession market trader reacted to economic news. The court market trader held their position. Over the following five days, the recession market rebounded more than 10 cents while the court market continued higher. The court market was right to not react.
Quantitative Summary
| Recession Market | Court Refund Market | |
|---|---|---|
| Market ID | 609655 | 1126854 |
| Current price | 30¢ | 52.5¢ |
| 2026 low | 19.5¢ (Apr 9) | 12.8¢ (Jan 18) |
| 2026 high | 44.5¢ intraday (Apr 8) | 50.2¢ (Mar 17) |
| Cumulative volume | ~$1.2B | ~$497M |
| Max single-day swing (2026) | -40% (Apr 9) | +47% (Mar 17) |
| Direction since Jan | Flat (started ~26¢, now ~30¢) | Up +40¢ (started 12.8¢, now 52.5¢) |
Replicating This Analysis
Here's how to pull both markets and run this comparison yourself using the polymarketdata SDK:
import pandas as pd
import matplotlib.pyplot as plt
from polymarketdata import PolymarketDataClient, Resolution

RECESSION_SLUG  = "us-recession-by-end-of-2026"
COURT_SLUG      = "will-the-court-force-trump-to-refund-tariffs-2026-06-30"
START           = "2026-01-01T00:00:00Z"
END             = "2026-04-15T00:00:00Z"

with PolymarketDataClient(api_key="YOUR_API_KEY") as client:

    # Pull daily prices for both markets
    rec_prices   = client.history.get_market_prices(
        RECESSION_SLUG, start_ts=START, end_ts=END,
        resolution=Resolution.ONE_DAY
    )
    court_prices = client.history.get_market_prices(
        COURT_SLUG, start_ts=START, end_ts=END,
        resolution=Resolution.ONE_DAY
    )

    # Pull volume/spread metrics
    rec_metrics   = client.history.get_market_metrics(
        RECESSION_SLUG, start_ts=START, end_ts=END,
        resolution=Resolution.ONE_DAY
    )
    court_metrics = client.history.get_market_metrics(
        COURT_SLUG, start_ts=START, end_ts=END,
        resolution=Resolution.ONE_DAY
    )

# Convert to DataFrames
def to_df(price_resp, label):
    df = price_resp.to_dataframe_prices()
    # Keep only the Yes outcome
    df = df[df["outcome"] == "Yes"].copy()
    df["date"] = pd.to_datetime(df["t"]).dt.date
    df = df.groupby("date")["price"].mean().reset_index()
    df.columns = ["date", label]
    return df

rec_df   = to_df(rec_prices,   "recession_yes")
court_df = to_df(court_prices, "court_yes")

combined = rec_df.merge(court_df, on="date", how="outer").sort_values("date")
combined["date"] = pd.to_datetime(combined["date"])

# Plot
fig, ax = plt.subplots(figsize=(12, 5))
ax.plot(combined["date"], combined["recession_yes"],  label="Recession by EOY 2026",   color="#f5a623")
ax.plot(combined["date"], combined["court_yes"],      label="Court Forces Tariff Refund", color="#4a9eff")
ax.axhline(0.5, linestyle="--", color="gray", alpha=0.5)
ax.yaxis.set_major_formatter(plt.FuncFormatter(lambda x, _: f"{int(x*100)}¢"))
ax.legend(); ax.grid(alpha=0.3)
plt.tight_layout()
plt.savefig("tariff_markets.png", dpi=150)
To compute the April 9 divergence explicitly:
apr9 = combined[combined["date"] == pd.Timestamp("2026-04-09")].squeeze()
apr8 = combined[combined["date"] == pd.Timestamp("2026-04-08")].squeeze()

rec_move   = (apr9["recession_yes"]  - apr8["recession_yes"])  / apr8["recession_yes"]
court_move = (apr9["court_yes"]      - apr8["court_yes"])      / apr8["court_yes"]

print(f"Recession market Apr 8→9: {rec_move:+.1%}")   # → −40.1%
print(f"Court market    Apr 8→9: {court_move:+.1%}")   # → +1.8%
The Trading Implication
The recession market over-reacts to news and snapbacks aggressively. Its best use as a signal is as a sentiment gauge, not a calibrated probability. When it hits extremes (below 20¢ or above 40¢), the historical pattern suggests mean-reversion is likely — though that's a thin dataset and this macro regime is genuinely uncertain.
The court market, by contrast, has been pricing a steady increase in legal risk for two months. At 52.5¢, it's essentially saying: "coin flip." That's a remarkably high probability for an outcome that most observers dismissed as implausible in January. The market's direction since mid-March suggests the sophisticated money is not selling this.
The key variable going forward: If the CIT issues a merits ruling against IEEPA tariff authority, you'd expect the court market to move sharply toward 70–80¢ and the recession market to fall (less tariff damage → lower recession risk). If the administration wins the legal battles, both move the other way. The 90-day pause has created a temporary ceasefire in the market chaos, but neither market thinks the fundamental questions are resolved.
The court market is where you go for signal. The recession market is where you go for noise.
All data from the polymarketdata.co API. Market IDs, full price history, and order book depth available at polymarketdata.co/docs.