SpaceX IPO on Polymarket: The Market Has Already Priced Day One
Polymarket gives SpaceX a 95.5% open-above-IPO pop but only 69% it closes up — a 26-point fade gap, plus a ~$2.2T implied day-1 cap. Full data.

SpaceX prices tonight and starts trading tomorrow on the Nasdaq under SPCX — a fixed $135 offer, ~555.6M shares, roughly $75B raised at a $1.75T valuation. That's the biggest IPO in history by a factor of more than two over Saudi Aramco. The financial press is wall-to-wall on the valuation.
Here's what the news won't tell you: Polymarket has already priced the shape of the first trading day, and the shape is more interesting than the headline number. Traders give it a 95.5% chance the stock opens above the $135 offer price, but only a 69% chance it closes its first day up. That 26-point gap is the entire story. The crowd is near-certain there's an opening pop and genuinely unsure it survives to the close.
The day-one trade, decomposed
Pull the live prices on the three day-one markets and the structure jumps out:
| Market | Yes price | What it implies |
|---|---|---|
| Open price above IPO price ($135) | 95.5¢ | An opening pop is near-certain |
| Closing share price up on first day | 69.0¢ | Roughly 1-in-3 odds it gives the pop back |
| Trading halted for volatility | 42¢ | Crowd sees a near-coin-flip on a halt |
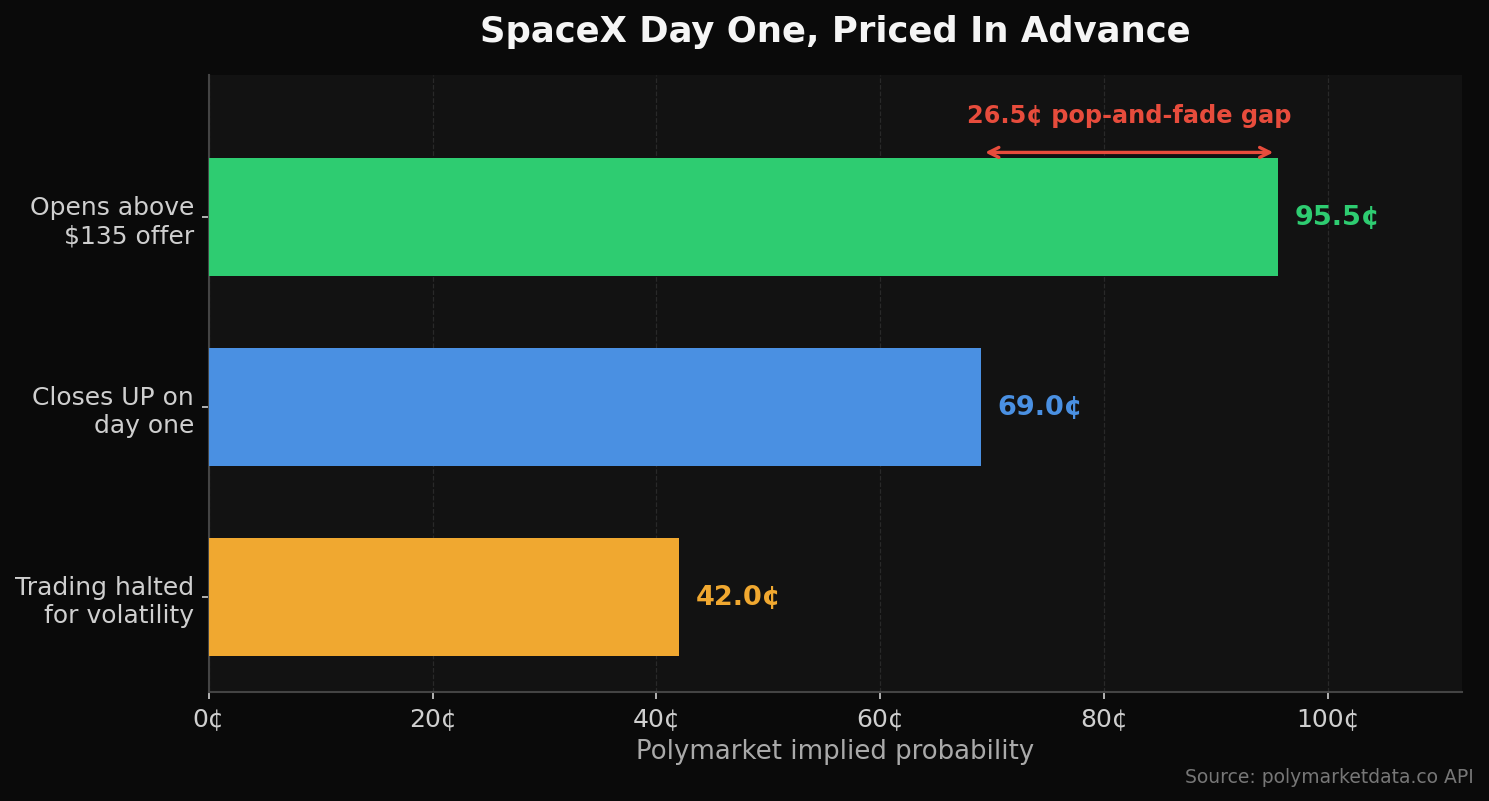
Read those two top rows together. Conditional on opening above $135 — which the market treats as a near-given — there's about a 27% implied probability the stock round-trips and closes below the offer price. This is the classic IPO pop-and-fade, except you can see the crowd pricing it in advance instead of reading about it in the post-mortem. And the third row underlines how violent the open could be: a 42% implied chance of a volatility halt on day one. That market is thinner than the date and pop contracts, so treat the precise number with caution — but directionally, the book is bracing for chaos.
The valuation ladder tells the same story in market-cap space. Polymarket runs a strike ladder on SpaceX's closing market cap on IPO day, and right now it looks like this:
| Closing market cap above… | Probability |
|---|---|
| $1.0T | 99.2% |
| $1.6T | 90.4% |
| $1.8T | 83.5% |
| $2.0T | 69.5% |
| $2.2T | 47.5% |
| $2.4T | 29.5% |
| $2.6T | 16.5% |
| $3.0T | 7.0% |
| $4.0T | 1.3% |
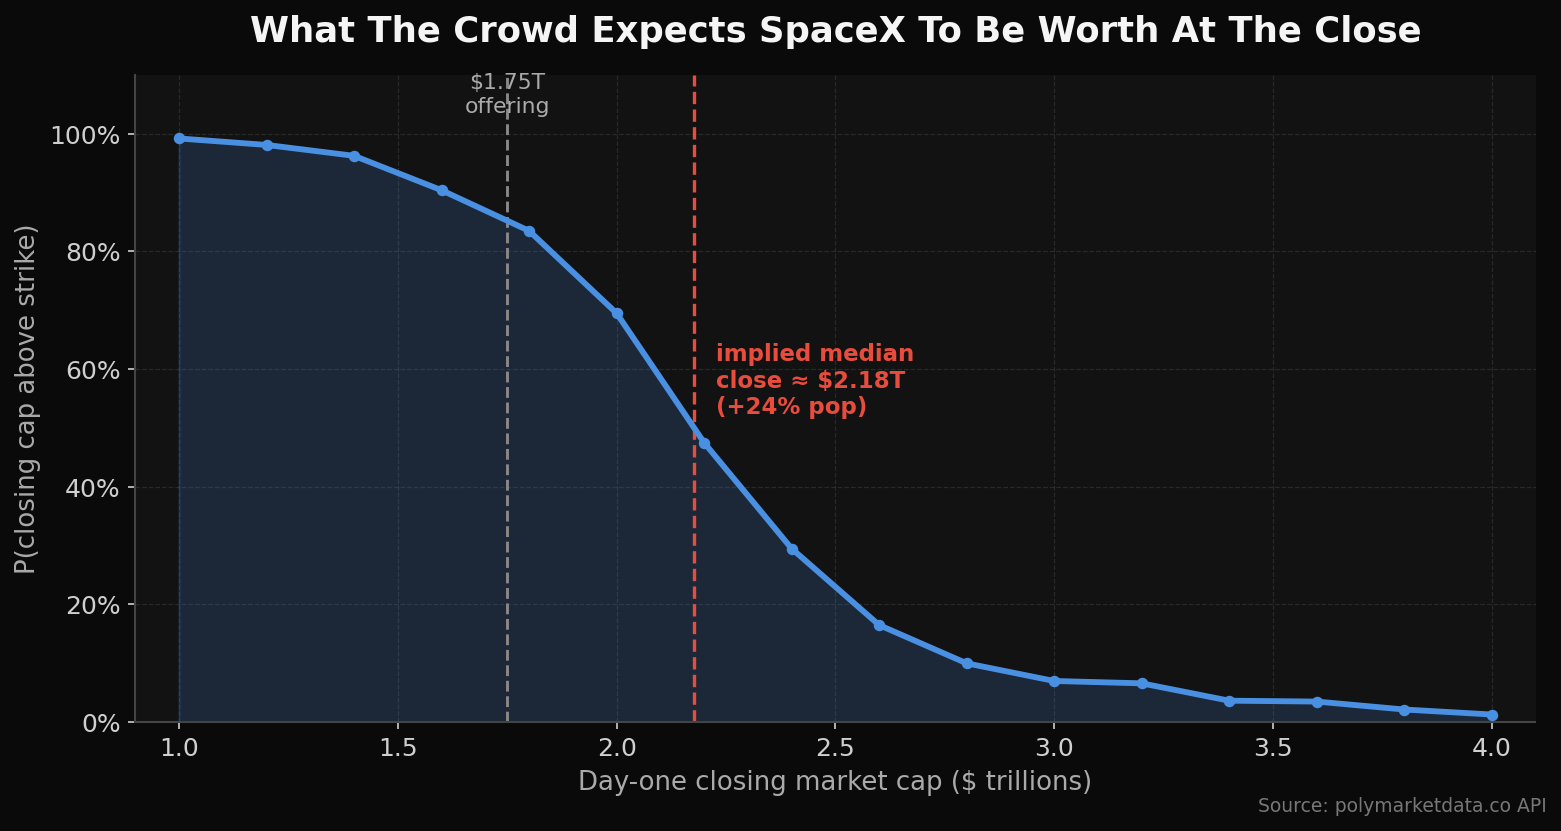
Interpolating across the strikes, the implied median day-one closing cap is about $2.18T — call it a 24% pop over the $1.75T offering valuation. Not a moonshot, not a flop: the market is pricing a solid, orderly first-day gain with a fat right tail it mostly doesn't believe in. Everything above $3T is priced as a lottery ticket.
How the date locked in: the roadshow was the catalyst
The reason any of this is tradeable today is that the date stopped being a question. Polymarket runs a daily ladder — "Will SpaceX IPO on June X?" — and as of last night it's a point mass:
- June 12: 98.2¢
- Every other date in the ladder: under 1¢
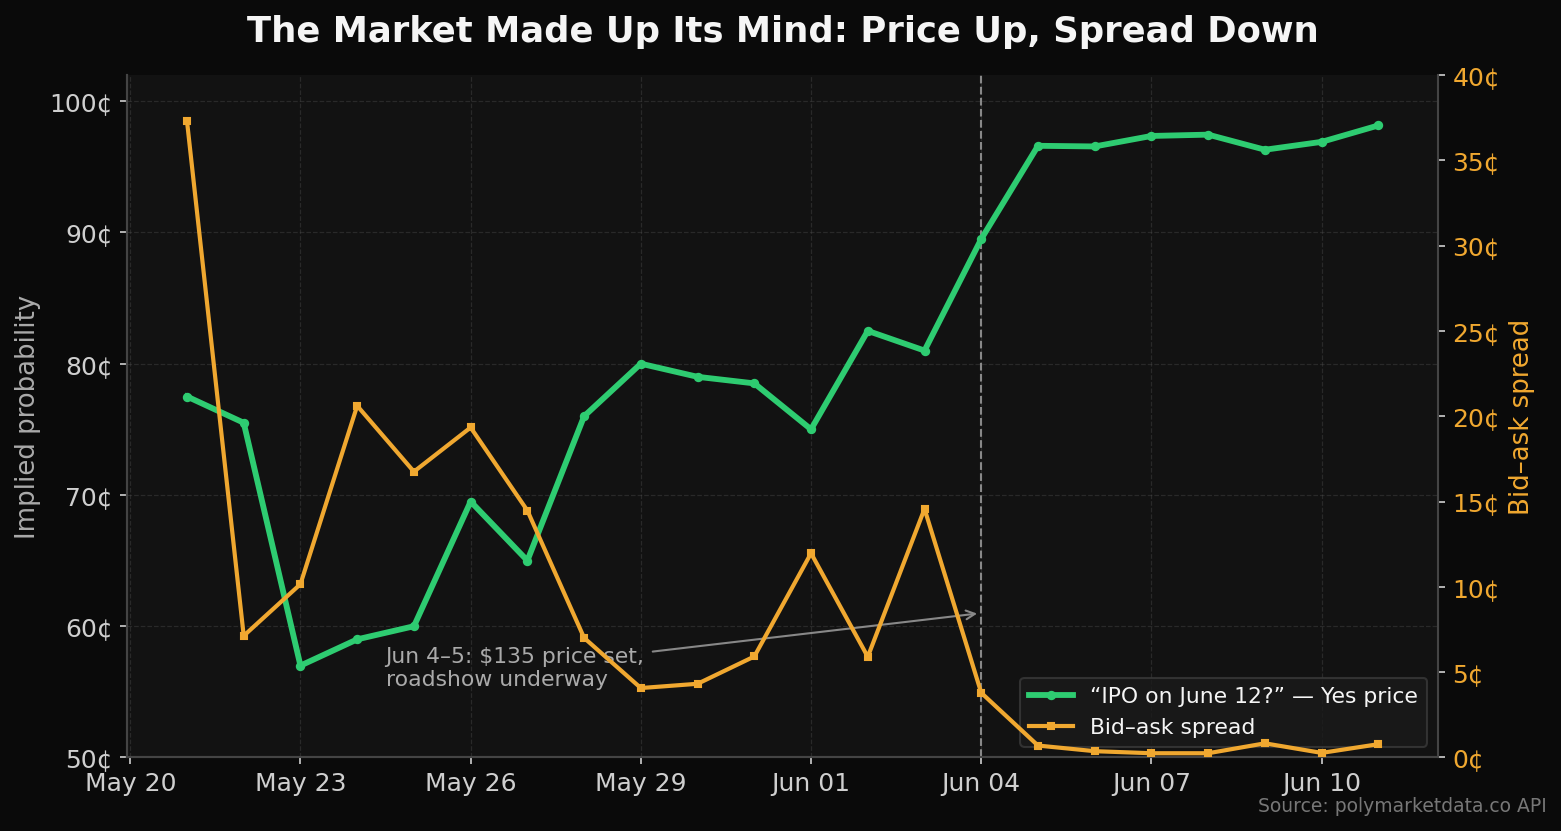
It wasn't always this clean. The June 12 market opened around 60¢ on May 21 and chopped between 56¢ and 82¢ for two weeks. Then it moved in two discrete steps tied to two news beats:
- Just after midnight on June 4, the contract jumped from ~78¢ to 86¢ within an hour — the report that SpaceX had set a fixed $135 price and launched its roadshow.
- The morning of June 5, it stepped again from ~89¢ to 95.5¢ as the roadshow got underway and the $135 level held.
You can watch the order book digest each headline in real time:
| Date | Time | Price | Event |
|---|---|---|---|
| June 3 | 23:00 | 0.789 | |
| June 4 | 00:00 | 0.863 | ← fixed-price report breaks |
| June 4 | 22:00 | 0.925 | |
| June 5 | 07:00 | 0.925 | |
| June 5 | 08:00 | 0.955 | ← roadshow launch confirmed |
| June 5 | 11:00 | 0.960 |
The microstructure confirms the conviction was real, not a thin-book artifact. On the June 12 market, the bid-ask spread collapsed from 37¢ on May 21 to 0.7¢ on June 5 to 0.25¢ by June 7, while daily volume went from a few million to $111M on June 10 and liquidity on the book climbed from ~$830 to nearly $70K. Spread compression plus a volume surge plus rising depth is the signature of a market that has actually made up its mind — uncertainty draining out of the price, not just a quiet drift.
The graveyard behind the gravestone
Worth remembering how many times this trade head-faked everyone. SpaceX's IPO has been a Polymarket fixture for over a year, and the timing markets are a graveyard of NO resolutions:
- "IPO by April 30" spiked to 33¢ on March 25, then collapsed to single digits and resolved NO.
- "IPO by May 31" never cleared 10¢ and bled to 0.05¢ before resolving NO.
- "IPO by June 30" rode around 70¢ for months, jumped to 91¢ on May 15, and only convicted to 99¢+ after the June 4 roadshow.
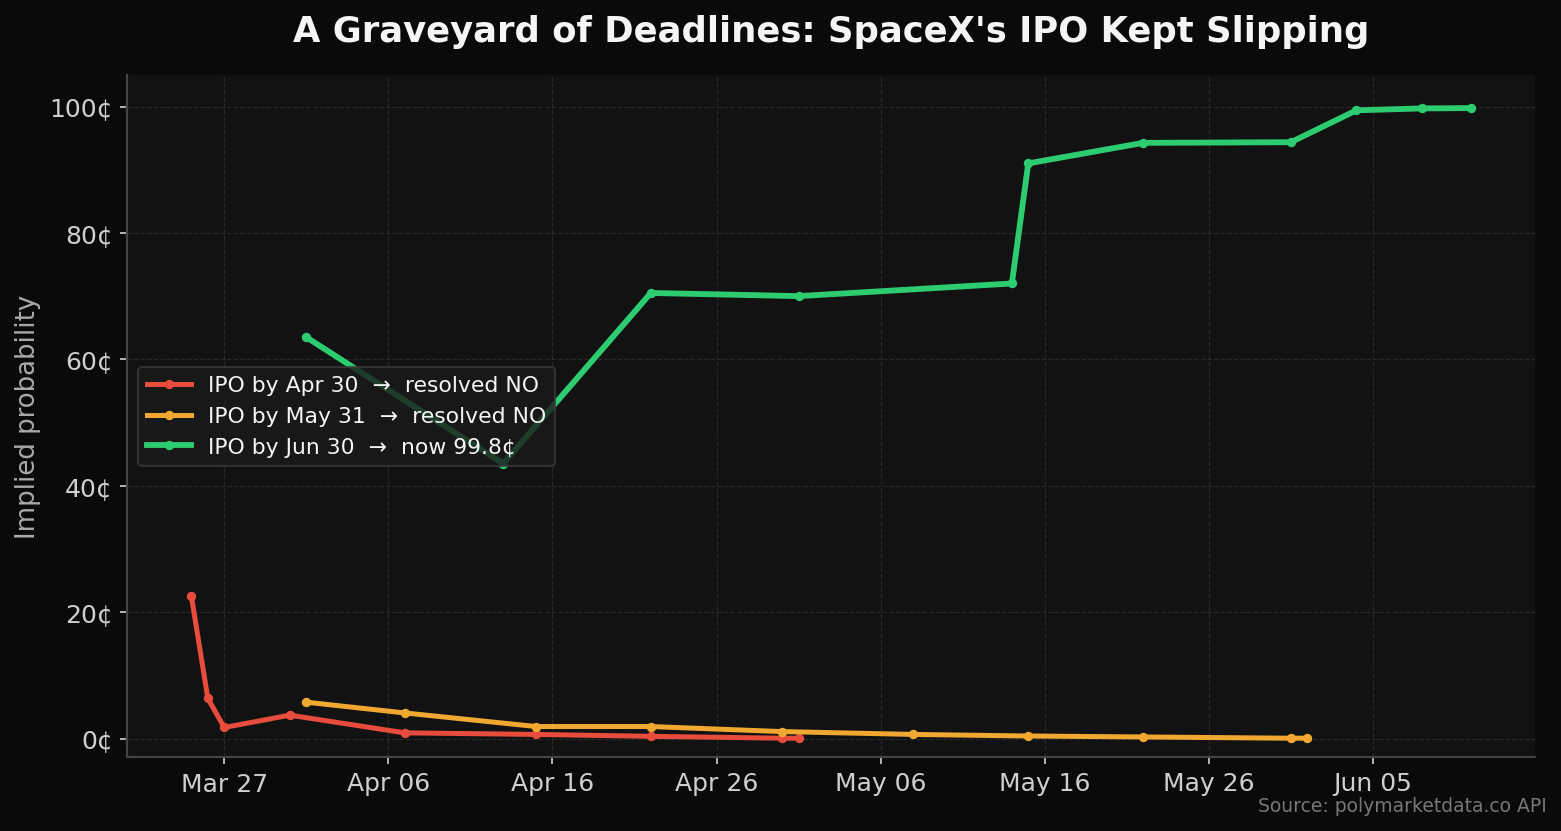
The lesson the data keeps teaching: pre-announcement IPO-timing markets are dominated by slippage risk, and the crowd was right to discount every "imminent" rumor until the roadshow actually priced. The edge wasn't in guessing the date early — it was in waiting for the spread to collapse.
Replicate it
Everything above is one discovery call plus a few history pulls. Here's the full day-one snapshot in Python using the polymarketdata.co API:
import os, requests
import pandas as pd

API_KEY = os.environ["POLYMARKETDATA_API_KEY"]
BASE = "https://api.polymarketdata.co/v1"
HEADERS = {"X-API-Key": API_KEY}

def latest_yes_price(slug, label="Yes"):
    """Most recent traded price for a market's outcome token."""
    m = requests.get(f"{BASE}/markets/{slug}", headers=HEADERS, timeout=30).json()
    token = next(t for t in m["data"]["tokens"] if t["label"] == label)
    p = requests.get(
        f"{BASE}/tokens/{token['id']}/prices",
        headers=HEADERS,
        params={"resolution": "1m", "limit": 1, "order": "desc"},
        timeout=30,
    ).json()
    return float(p["data"][0]["price"])

day_one = {
    "open_above_ipo":  "spacex-ipo-open-price-above-ipo-price-20260608141838202",
    "closes_up_day1":  "spacex-ipo-closing-share-price-updown-on-first-day-20260607181533420",
    "ipo_on_june_12":  "will-spacex-ipo-on-june-12-2026-957",
}

for name, slug in day_one.items():
    print(f"{name:18s} {latest_yes_price(slug):.3f}")
And the implied median market cap from the strike ladder — the same interpolation that produces the ~$2.18T number:
import numpy as np

# (strike in $T, P(cap above strike)) from the closing-market-cap ladder
ladder = [
    (1.0, 0.992), (1.2, 0.981), (1.4, 0.9625), (1.6, 0.904),
    (1.8, 0.835), (2.0, 0.695), (2.2, 0.475), (2.4, 0.295),
    (2.6, 0.165), (2.8, 0.10),  (3.0, 0.07),   (3.2, 0.066),
    (3.4, 0.0365),(3.6, 0.035), (3.8, 0.0215), (4.0, 0.013),
]
strikes = np.array([s for s, _ in ladder])
probs   = np.array([p for _, p in ladder])

# P(above strike) is a decreasing survival curve; find where it crosses 0.50
median_cap = np.interp(0.50, probs[::-1], strikes[::-1])
print(f"Implied median day-1 closing cap: ${median_cap:.2f}T")
# Implied first-day pop vs the $1.75T offering valuation
print(f"Implied pop: {(median_cap/1.75 - 1)*100:.1f}%")
To pull the full date-lock-in trajectory with the spread collapse — the chart that shows the roadshow catalyst — grab metrics alongside prices:
prices = requests.get(
    f"{BASE}/markets/will-spacex-ipo-on-june-12-2026-957/prices",
    headers=HEADERS,
    params={"start_ts": "2026-05-21T00:00:00Z", "resolution": "1h"},
    timeout=30,
).json()
metrics = requests.get(
    f"{BASE}/markets/will-spacex-ipo-on-june-12-2026-957/metrics",
    headers=HEADERS,
    params={"start_ts": "2026-05-21T00:00:00Z", "resolution": "1h"},
    timeout=30,
).json()

px = pd.DataFrame(prices["data"]);   px["t"] = pd.to_datetime(px["t"], utc=True)
mx = pd.DataFrame(metrics["data"]);  mx["t"] = pd.to_datetime(mx["t"], utc=True)
panel = px.merge(mx, on="t")[["t", "price", "spread", "volume"]]
print(panel.tail(48))   # watch spread fall from cents to a quarter-cent
The trade
If you have a directional view on SpaceX's debut, Polymarket is offering you cleaner instruments than the equity itself — you can express "pops on the open but fades by the close" as a single spread (long open-above-IPO, short closes-up) for a net ~26.5¢ of carry, which is precisely the round-trip probability the market is quoting. The risk is obvious: these are first-of-their-kind markets on a one-off event with no base rate to lean on, the resolution conventions ("up" relative to what reference) deserve a careful read before you size anything, and the valuation ladder is thinner than the date markets. But the date is no longer the question, and the book is deep enough that the day-one pricing is real signal, not noise.
The crowd thinks SpaceX pops about 25% and then has a one-in-three chance of handing it all back by 4pm. Tomorrow we find out whether the order book was ahead of the tape again.
All data from the polymarketdata.co API. Full endpoint reference at polymarketdata.co/docs.