The $160K Bet: Inside the Polymarket Iran Ceasefire Trade That Looks Like Insider Dealing
Ten coordinated wallets bought Polymarket's Iran ceasefire-by-March-31 market at 6¢ on March 21. Forty-eight hours later the price hit 32¢. We pulled every minute of the data.

Ten wallets. Created around the same time. No prior history. Between them, they put $160,000 into Polymarket's "US × Iran ceasefire by March 31?" market on March 21–22 — when the Yes token was trading at 6 to 10 cents.
Forty-eight hours later, a leaked ceasefire proposal sent the price to 32 cents. If those wallets exited near the top, they turned a roughly $160K position into something north of $500K.
Then Iran rejected the proposal, and the price crashed back to 10 cents.
We pulled the full price-minute and volume history from our ClickHouse database to answer the one question that actually matters here: did the order book know something before the news did?
What the Market Looked Like Before the Spike
This isn't a market that was quietly sitting at 6 cents. It opened on March 1 — the day of the first US-Israeli airstrikes — at around 63 cents. The crowd believed there was a better-than-even chance of a ceasefire within the month.
Then reality set in.
Over the next three weeks, the market collapsed in near-continuous steps:
- March 4: ~34 cents
- March 8: ~23 cents
- March 13: ~20 cents
- March 16: ~9.5 cents (near-term lows)
- March 19–20: 5.5 to 7.5 cents
By the third week of March, traders were pricing a ceasefire-by-March-31 at roughly 1-in-16 odds. Iran's supreme leader had just vowed to block the Strait of Hormuz. US troops were deploying. A deal in 10 days felt like a long shot.
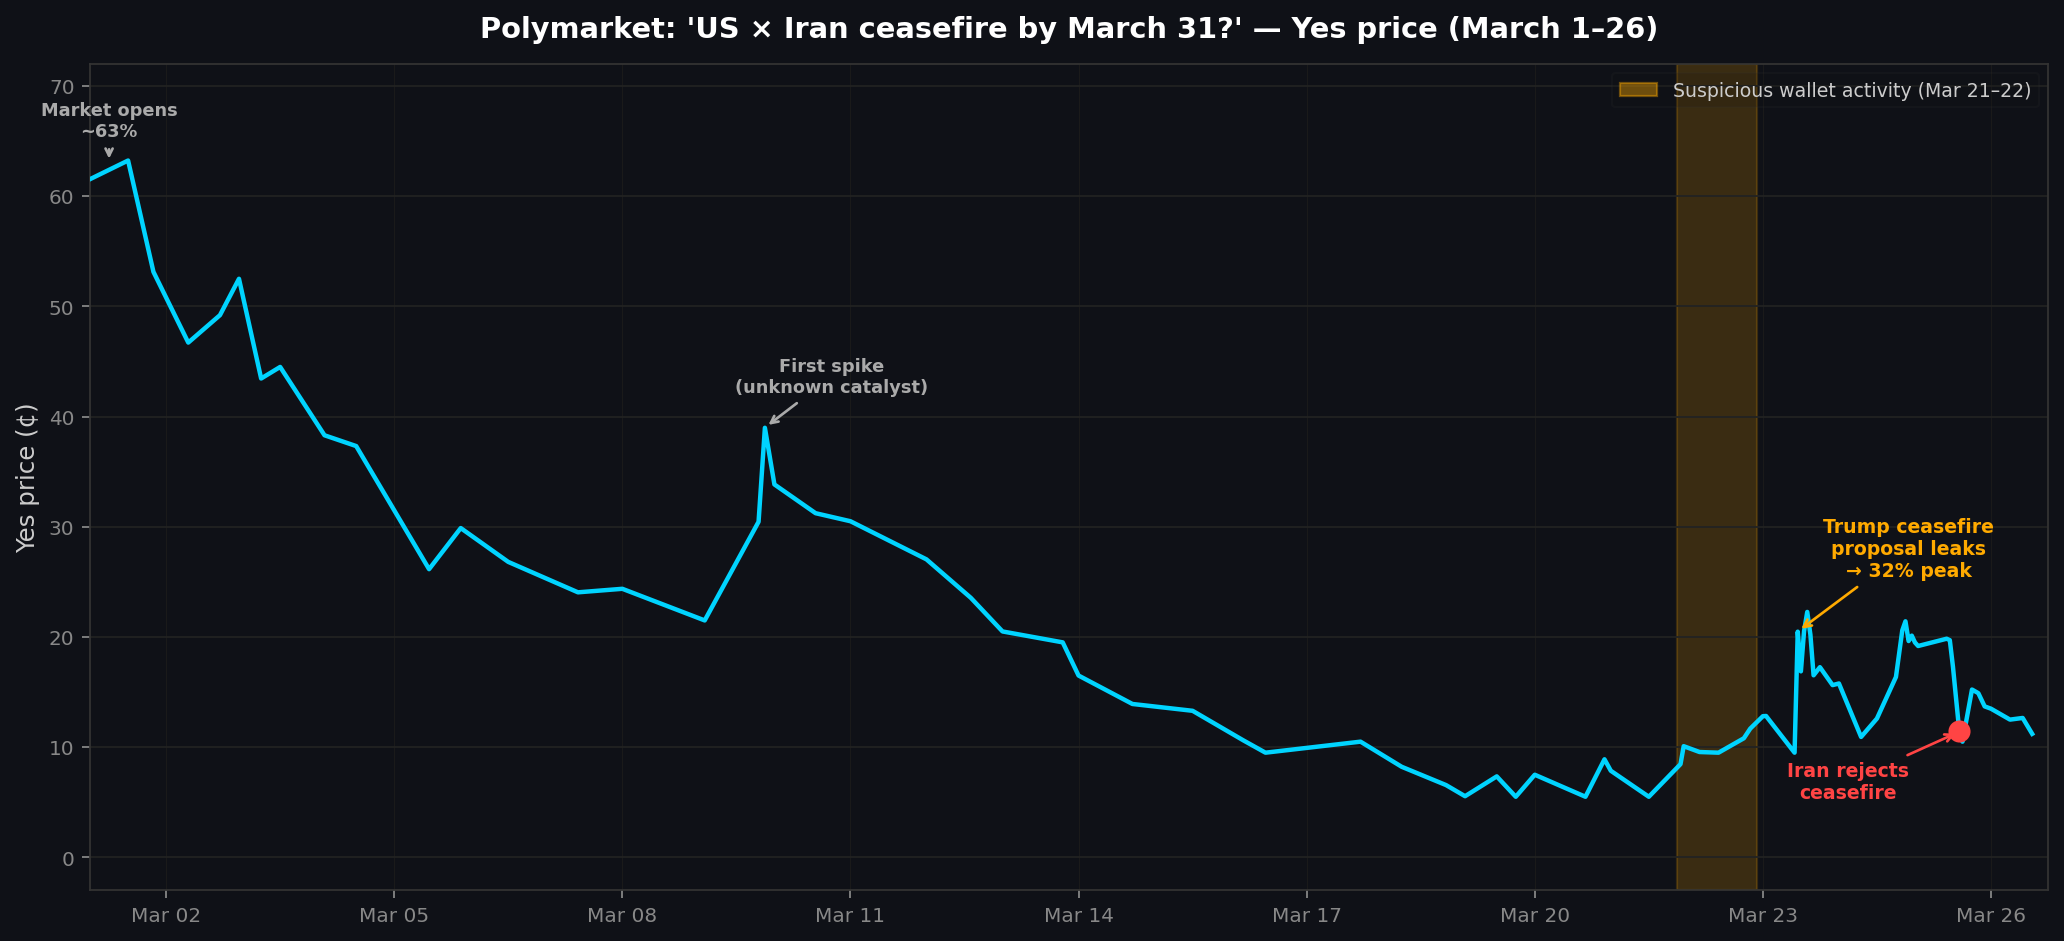
That's the context the suspicious wallets walked into. They weren't buying a market in equilibrium — they were buying near a multi-week floor, 10 days before expiry, on a market the crowd had largely written off.
Volume First, Price Second
Here's the part that's hard to explain away as coincidence.
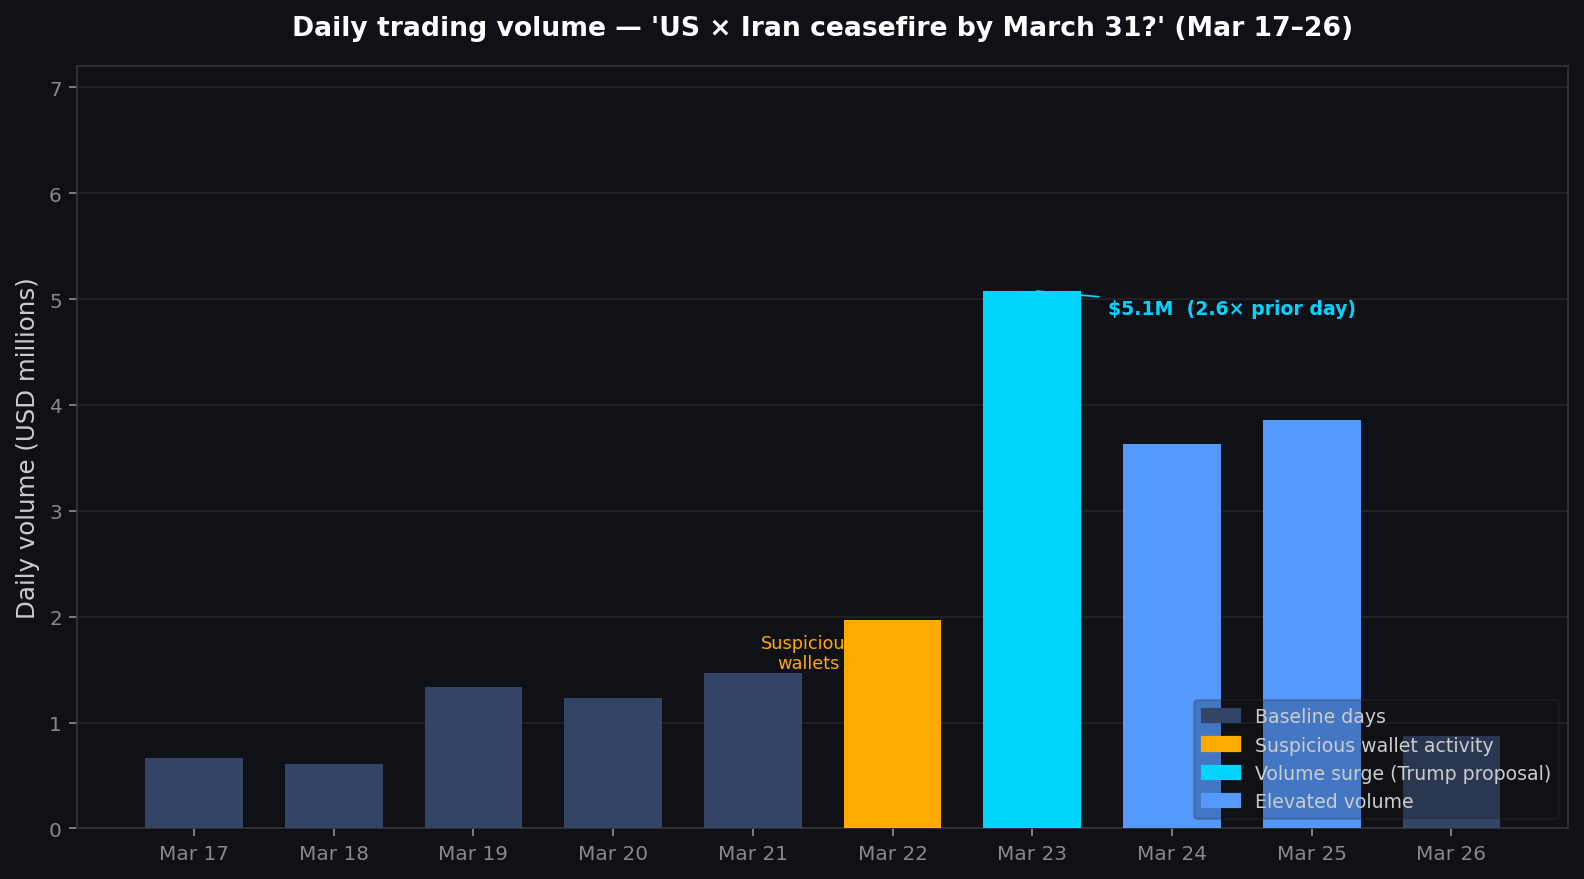
Baseline daily volume on this market in the week ending March 21 was running $1.0–1.5M per day — healthy for a geopolitical market, but not exceptional given the Iran conflict's scale.
Then:
| Date | Daily Volume | vs. Prior Day |
|---|---|---|
| Mar 20 | $1.23M | — |
| Mar 21 | $1.47M | +20% |
| Mar 22 | $1.97M | +34% ← suspicious wallet activity |
| Mar 23 | $5.08M | +158% ← price spikes to 32¢ |
| Mar 24 | $3.64M | -28% |
| Mar 25 | $3.86M | +6% |
Volume on March 22 — the day of coordinated buying — was up 34% vs. the prior day. Not massive on its own. But then March 23 hit $5.08M, 2.6× the March 22 level and the highest single day since the market launched. And the price didn't move on March 22. It moved on March 23.
That's the classic pattern: volume ramps before price. The order book was absorbing informed positions at 6–10 cents. Then the news broke publicly, retail flooded in, and the price repriced sharply higher.
The timing is precise. According to on-chain data reported by Bitcoin News and the Times of Israel, the 10 coordinated wallets executed their buys on the evening of March 21 (Eastern time). That's the March 22 UTC candle in our volume data — the bar that shows the first uptick above baseline. The price that day barely moved: it went from ~7.5 cents to ~10–12 cents by end of day.
Then March 23 at 11:00 UTC: Trump's ceasefire proposal leaked. The market went from 9.5 cents to 32 cents in a single hour. Our minute-level data shows the spike was essentially vertical — no gradual repricing, just a step change as the order book cleared.
The 5× Return Window and the Collapse
If those wallets were at ~6–8 cents and could exit near 28–32 cents — which required selling into the March 23 spike and the secondary spike on March 24 evening (21:00 UTC, price again hit ~24 cents) — the math on a $160K position works out to roughly:
- Entry: ~$160K at ~7¢ average → ~2.3M contracts
- Peak exit at 28¢ → ~$644K gross
- Net profit: ~$484K on $160K deployed, a 3× return in 48 hours
That's assuming near-perfect exits, which is a big assumption. But even a partial exit into the March 23 spike — which had massive volume to absorb sells — would have been highly profitable.
The collapse was just as fast. On March 25 at 12:00–14:00 UTC, as Iran's foreign minister announced his government had not engaged in ceasefire talks and rejected the US proposal, the price fell from 19.5 cents to 10.5 cents in two hours. Anyone holding through the rejection gave back most of the gain.
Is This Insider Trading? The Data Can't Prove It
What the data establishes:
- A cluster of new wallets with no prior activity took concentrated long positions at cycle lows (6–10 cents)
- Volume led price by approximately 24–36 hours
- The triggering event — Trump's ceasefire proposal — wasn't publicly reported until March 23
- Two of these wallets had previously profited from accurately predicting the timing of the February 28 airstrikes
What the data can't tell you: whether those wallets had inside information, made a well-reasoned bet on public signals, or got extraordinarily lucky. Trump had posted on Truth Social on March 21 that he was "considering winding down" the Iran campaign — that's a public signal. Someone paying close attention could have plausibly reasoned that a formal proposal was coming.
The coordinated execution pattern — $7K to $24K each, aggressive market orders, same wallets timing their entry simultaneously — doesn't point toward retail speculation. That's operational discipline. But operational discipline isn't the same as illegally traded material non-public information.
Polymarket updated its terms on March 24 to explicitly prohibit trading on "stolen confidential information, illegal tips, or by someone who could influence an outcome." Senators Schiff and Curtis have introduced legislation arguing those rules don't go far enough — pointing out that staff, advisers, and cabinet relatives can still trade freely.
The market, as it stands, is not adjudicating those legal questions. It's just moving price.
How to Pull This Data Yourself
If you want to run your own analysis on the ceasefire market, here's the full flow using the polymarketdata.co API:
import os
import requests
import pandas as pd
import matplotlib.pyplot as plt
from datetime import datetime, timezone

API_KEY = os.environ["POLYMARKETDATA_API_KEY"]
BASE = "https://api.polymarketdata.co/v1"
HEADERS = {"X-API-Key": API_KEY}

# The "US x Iran ceasefire by March 31?" market slug
MARKET_SLUG = "us-x-iran-ceasefire-by-march-31"

# ── Pull hourly prices ────────────────────────────────────────────────────────
def fetch_all(endpoint, params):
    results = []
    while True:
        r = requests.get(f"{BASE}/{endpoint}", headers=HEADERS, params=params, timeout=30)
        r.raise_for_status()
        data = r.json()
        results.extend(data["data"])
        cursor = data.get("metadata", {}).get("next_cursor")
        if not cursor:
            break
        params = {**params, "cursor": cursor}
    return results

prices_raw = fetch_all(f"markets/{MARKET_SLUG}/prices", {
    "start_ts": "2026-03-01T00:00:00Z",
    "end_ts":   "2026-03-27T00:00:00Z",
    "resolution": "1h",
    "limit": 200,          # max allowed per page
})

metrics_raw = fetch_all(f"markets/{MARKET_SLUG}/metrics", {
    "start_ts": "2026-03-01T00:00:00Z",
    "end_ts":   "2026-03-27T00:00:00Z",
    "resolution": "1d",
    "limit": 200,
})

# prices endpoint returns one row per token — filter to Yes side
df_p = pd.DataFrame(prices_raw)
df_p["t"] = pd.to_datetime(df_p["t"], utc=True)
df_p["p"] = df_p["p"].astype(float)          # field is "p", range 0.0–1.0

# if the market has multiple tokens, get the market detail first to find Yes token id
market_resp = requests.get(f"{BASE}/markets/{MARKET_SLUG}", headers=HEADERS, timeout=30)
market_resp.raise_for_status()
yes_token_id = next(
    t["id"] for t in market_resp.json()["tokens"] if t["label"] == "Yes"
)
df_p = df_p[df_p["token_id"] == yes_token_id].copy()

df_m = pd.DataFrame(metrics_raw)
df_m["t"] = pd.to_datetime(df_m["t"], utc=True)
df_m["volume"] = df_m["volume"].astype(float)

# ── Volume is cumulative — diff to get daily increments ───────────────────────
df_m = df_m.sort_values("t")
df_m["daily_volume"] = df_m["volume"].diff().fillna(df_m["volume"].iloc[0])

# ── Plot ──────────────────────────────────────────────────────────────────────
fig, (ax1, ax2) = plt.subplots(2, 1, figsize=(13, 9), sharex=False)

# Price chart — "p" is 0–1, multiply by 100 for cents
ax1.plot(df_p["t"], df_p["p"] * 100, color="#00d4ff", linewidth=1.8)
ax1.axvspan(
    pd.Timestamp("2026-03-21 21:00", tz="UTC"),
    pd.Timestamp("2026-03-22 22:00", tz="UTC"),
    alpha=0.2, color="#ffaa00", label="Suspicious wallets"
)
ax1.set_ylabel("Yes price (¢)")
ax1.set_title("'US × Iran ceasefire by March 31?' — Price and Volume Analysis")
ax1.legend(loc="upper right")
ax1.grid(axis="y", alpha=0.3)

# Volume chart
colors = ["#ffaa00" if str(d.date()) == "2026-03-22"
          else "#00d4ff" if str(d.date()) == "2026-03-23"
          else "#5599ff" if str(d.date()) in ("2026-03-24", "2026-03-25")
          else "#334466"
          for d in df_m["t"]]
ax2.bar(df_m["t"], df_m["daily_volume"] / 1e6, color=colors, width=pd.Timedelta("18h"))
ax2.set_ylabel("Daily volume (USD millions)")
ax2.grid(axis="y", alpha=0.3)

plt.tight_layout()
plt.savefig("ceasefire_analysis.png", dpi=150, bbox_inches="tight")
print("Chart saved.")
The /markets/{slug} endpoint returns the full token list with IDs and labels — use that to isolate the Yes token before filtering the price series. The metrics endpoint returns cumulative volume, so you diff it for daily increments. Both history endpoints page at 200 records max; the fetch_all helper above handles that automatically.
What This Means for Traders
If you're trading political prediction markets, the actionable observation here isn't "insider trading is bad." It's that volume changes in prediction markets contain information that price hasn't yet processed.
The standard model assumes price leads everything — the market aggregates information continuously and efficiently. What we're seeing in the Iran ceasefire market is a case where volume led price by roughly 24 hours. The order book absorbed $1.97M in buys on March 22 without the price moving materially beyond the 10-cent range. It took until the next day — when the news was public — for the price to reprice.
A simple volume-breakout signal — flag any market where daily volume exceeds 1.5× its 7-day moving average — would have flagged March 22 as a candidate. Whether you'd have had the conviction to buy a 10-cent ceasefire probability two days before expiry is a separate question.
The March 25 collapse is the other half of the lesson. Even if you had perfect entry timing, Iran's rejection wiped out two-thirds of the gain in two hours. Political markets don't just let you be right — they make you right at exactly the right moment. Getting the direction correct but holding through a sharp reversal is how most alpha in these markets gets surrendered.
The ceasefire-by-March-31 market expires in five days. It's at ~12 cents as of March 26. If you have a view on whether Vance and Rubio's backchannel talks with Tehran produce something concrete in that window, that's the bet to make.
All data from the polymarketdata.co API. Full endpoint reference at polymarketdata.co/docs.