Polymarket's Bulgaria Election Call: 83.5¢ Conviction That Never Wavered
Polymarket priced Radev's Progressive Bulgaria at 83.5¢ to win a month before the vote. Here's what the price trajectory and volume ramp reveal about crowd intelligence on niche elections.
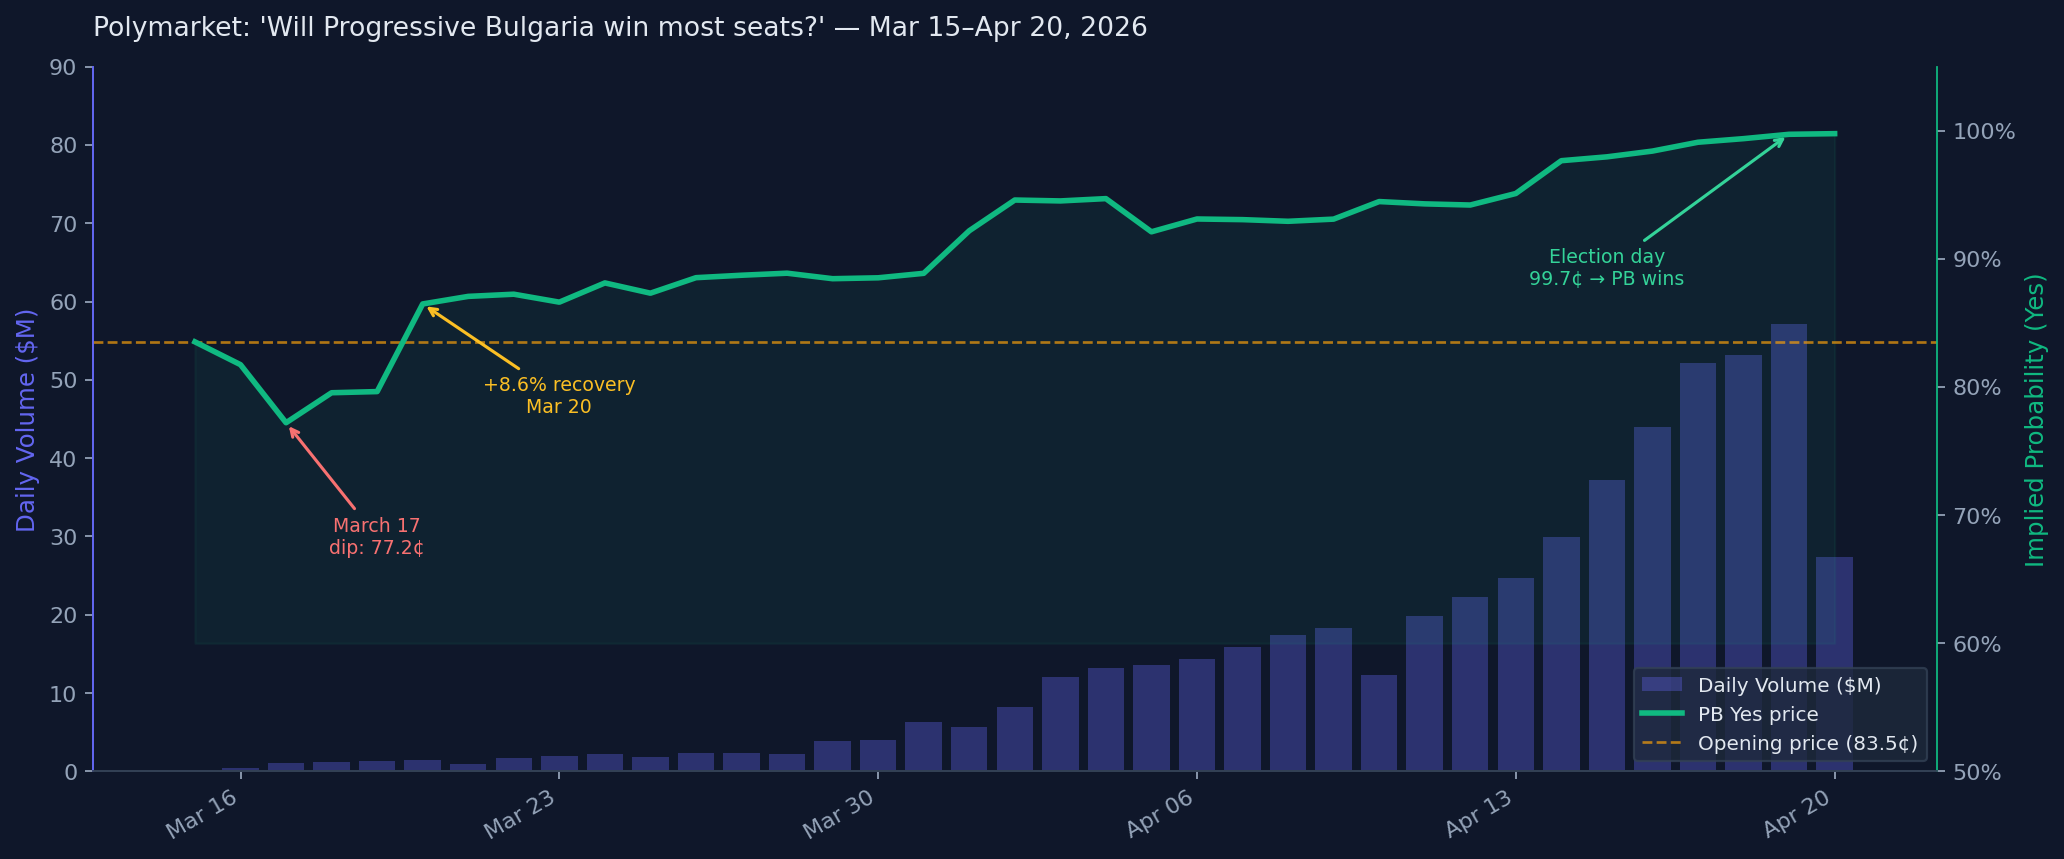
Bulgaria just held its eighth parliamentary election in five years. Ex-president Rumen Radev's Progressive Bulgaria party won 44.7% of the vote — an outright plurality that puts him in line for the prime ministership. The result matched what Polymarket traders had been pricing in since the market opened on March 15: an opening print of 83.5 cents, a brief dip to 77.2 cents on March 17, and then a relentless grind toward certainty that closed at 99.7 cents on election day.
The market was never below 77¢. For the 36 days it ran, the crowd never had real doubt.
The Price Never Had a Second Opinion
Here's the full daily close series for the "Will Progressive Bulgaria win the most seats?" Yes token:
| Date | Price | Notable |
|---|---|---|
| Mar 15 | 83.5¢ | Market opens |
| Mar 17 | 77.2¢ | Only significant dip |
| Mar 20 | 86.4¢ | +8.6% recovery — biggest single-day move |
| Mar 21–31 | 87–89¢ | Three-week consolidation |
| Apr 1 | 92.2¢ | +3.7% — second phase begins |
| Apr 2–12 | 92–95¢ | Continuation |
| Apr 14 | 97.7¢ | Final acceleration |
| Apr 17 | 99.1¢ | Near-certainty |
| Apr 19 | 99.7¢ | Election day |
That March 17 dip — from 83.5¢ to 77.2¢ over two days — was the only real opportunity to get long at a discount. It lasted 72 hours. By March 20, a single-day +8.6% move recovered it all and then some. After that, the market consolidated between 87¢ and 89¢ for eleven straight days before the April 1 jump kicked off the final march to resolution.
Two things drove this structure. First, pre-election polling had PB around 35% vote share — a number that made most mainstream commentators cautious about calling a majority. Polymarket wasn't cautious. It looked at fragmented opposition (GERB–SDS at ~12%, PP–DB at ~13%, three or four smaller parties splitting the rest) and priced in the correct inference: 35% in that field wins most seats. Second, liquidity grew as the market aged. Daily volume went from $124K on March 15 to $57M on election day — a 460x expansion — which means the final prices reflect far more capital-at-risk than the early prints.
The pre-election polling vs. market-implied probability comparison is worth sitting with. Polls measured vote share. Markets measure win probability. A party polling 35% in a seven-way field needs no special information to win 40%+ of seats — it just needs the other six parties to keep fragmenting. Polymarket priced that inference correctly from day one. Most election commentary didn't.
Volume Was the Real Signal
Volume alone told you the market had legs:
| Date | Volume | Notable |
|---|---|---|
| Mar 15 | $124K | Market opens |
| Mar 16 | $460K | +270% |
| Mar 20 | $1.5M | |
| Mar 29 | $3.9M | |
| Apr 1 | $5.7M | |
| Apr 7 | $15.9M | |
| Apr 14 | $30.0M | |
| Apr 17 | $52.2M | |
| Apr 18 | $53.2M | |
| Apr 19 | $57.1M | Election day |
The acceleration from April 7 to April 17 is the interesting window. Price was already above 93¢ by April 7, so new capital entering wasn't moving the price much — it was confirming a settled view, not discovering one. That $15M → $52M volume expansion in ten days represents sophisticated capital arriving late, not early. The information was priced in weeks earlier.
How to Pull This Yourself
The full analysis runs off the /v1/markets/{id}/prices and /v1/markets/{id}/metrics endpoints. Here's the exact code to reproduce the price trajectory and volume chart:
import os
import requests
import pandas as pd
import matplotlib.pyplot as plt
import matplotlib.dates as mdates

API_KEY = os.environ["POLYMARKETDATA_API_KEY"]
BASE = "https://api.polymarketdata.co/v1"
HEADERS = {"X-API-Key": API_KEY}

MARKET_SLUG = "will-progressive-bulgaria-pb-win-the-most-seats-in-the-2026-bulgarian-parliamentary-election"

def fetch_paginated(endpoint, params):
    results = []
    while True:
        r = requests.get(f"{BASE}/{endpoint}", headers=HEADERS, params=params, timeout=30)
        r.raise_for_status()
        data = r.json()
        results.extend(data["data"])
        cursor = data.get("metadata", {}).get("next_cursor")
        if not cursor:
            break
        params["cursor"] = cursor
    return results

# Fetch daily price and metrics
price_params = {
    "start_ts": "2026-03-15T00:00:00Z",
    "end_ts": "2026-04-20T00:00:00Z",
    "resolution": "1d",
}
metrics_params = {**price_params}

prices_raw = fetch_paginated(f"markets/{MARKET_SLUG}/prices", price_params)
metrics_raw = fetch_paginated(f"markets/{MARKET_SLUG}/metrics", metrics_params)

prices = pd.DataFrame(prices_raw)
prices["t"] = pd.to_datetime(prices["t"], utc=True)
prices = prices.rename(columns={"price": "yes_price"})

metrics = pd.DataFrame(metrics_raw)
metrics["t"] = pd.to_datetime(metrics["t"], utc=True)

df = prices.merge(metrics[["t", "volume"]], on="t", how="left")

# Plot: dual-axis price + volume
fig, ax1 = plt.subplots(figsize=(12, 5))

ax1.fill_between(df["t"], 0, df["volume"] / 1e6, alpha=0.2, color="#6366f1", label="Volume ($M)")
ax1.set_ylabel("Daily Volume ($M)", color="#6366f1")
ax1.tick_params(axis="y", labelcolor="#6366f1")
ax1.set_ylim(0, 80)

ax2 = ax1.twinx()
ax2.plot(df["t"], df["yes_price"], color="#10b981", linewidth=2.5, label="PB Yes Price")
ax2.axhline(0.835, color="#f59e0b", linestyle="--", linewidth=1.2, label="Opening price (83.5¢)")
ax2.set_ylabel("Implied Probability", color="#10b981")
ax2.tick_params(axis="y", labelcolor="#10b981")
ax2.set_ylim(0, 1.05)
ax2.yaxis.set_major_formatter(plt.FuncFormatter(lambda x, _: f"{x:.0%}"))

ax1.xaxis.set_major_formatter(mdates.DateFormatter("%b %d"))
ax1.xaxis.set_major_locator(mdates.WeekdayLocator(byweekday=0))
plt.setp(ax1.xaxis.get_majorticklabels(), rotation=30)

lines1, labels1 = ax1.get_legend_handles_labels()
lines2, labels2 = ax2.get_legend_handles_labels()
ax2.legend(lines1 + lines2, labels1 + labels2, loc="lower right")

ax1.set_title("Bulgaria Election 2026: PB Win Probability vs. Daily Volume", fontsize=13)
plt.tight_layout()
plt.savefig("bulgaria_election_2026.png", dpi=150)
plt.show()
If you want intraday data around the March 17 dip or the March 20 recovery, swap resolution to "1h" or "10m" and tighten the time window. The 1-minute data goes back 12+ months on pro+ plans.
The Opponent's View
For context, here's what the "Will PP–DB (We Continue the Change) win most seats?" Yes token looked like over the same period:
- March 15: 2.1¢
- March 29: brief spike to 5¢ (a single day, immediately faded)
- April 19: 0.45¢
The market gave the incumbent pro-EU coalition essentially no shot from the start. PP–DB ended up at 13.2% of the vote — second place, but not close to first. The crowd read the coalition arithmetic correctly.
What's the Next Trade
Bulgaria has a presidential election coming in Fall 2026. The "Next Prime Minister of Bulgaria" market already has Radev at 95.5 cents — near-certainty he takes the PM role, given PB's parliamentary majority. That market has ~$260K in volume and is likely to stay near 1.0 unless there's a coalition surprise.
The more interesting open question is the presidential race. Incumbent Iliana Iotova (who became president when Radev resigned in January) leads at ~41.5¢, with Nikolai Denkov from the pro-EU PP–DB bloc at ~26.5¢. If Radev consolidates power as PM and builds a stable government — the first one Bulgaria has had since 2021 — Iotova's incumbency advantage could widen. That race is five months out and currently undertraded relative to what we know about Bulgarian politics post-election.
The Bulgarian election markets just demonstrated something useful: niche European elections aren't exempt from crowd intelligence. If you were long PB Yes at any price below 90¢, you got paid. The crowd was right, and it was right early.
All data from the polymarketdata.co API. Full endpoint reference at polymarketdata.co/docs.