Is Polymarket Accurate? We Checked 14,760 Resolved Markets
We compared Polymarket prices 24 hours before close with how 14,760 markets resolved. Average calibration error: 0.9 points. Charts and Python code.

When LeBron James announced a partnership with Polymarket on September 5, many of the replies called it a gambling ad. Yesterday Pew Research reported that monthly volume on Kalshi and Polymarket doubled between May and July, mostly on sports. Both stories fed the same argument on X about whether prediction market prices carry any information.
There is a simple test for that. If Polymarket prices mean what they say, markets trading at 30¢ should resolve Yes about 30% of the time, and markets at 80¢ about 80% of the time. We ran that test on a year of resolved Polymarket markets.
We took the Yes/No markets that closed during 13 sampled weeks between September 2025 and September 2026. In the busier 2026 weeks, when Polymarket was resolving tens of thousands of markets a week, we used a random 20% to 50% sample. For each market we recorded the Yes price 24 hours before close, the bid-ask spread and cumulative volume at that moment, and the outcome. We kept markets with a spread of 5¢ or less and at least $500 traded by that point. That left 14,760 markets.
Across all of them, the price 24 hours out was 0.9 percentage points away from the actual Yes rate on average.
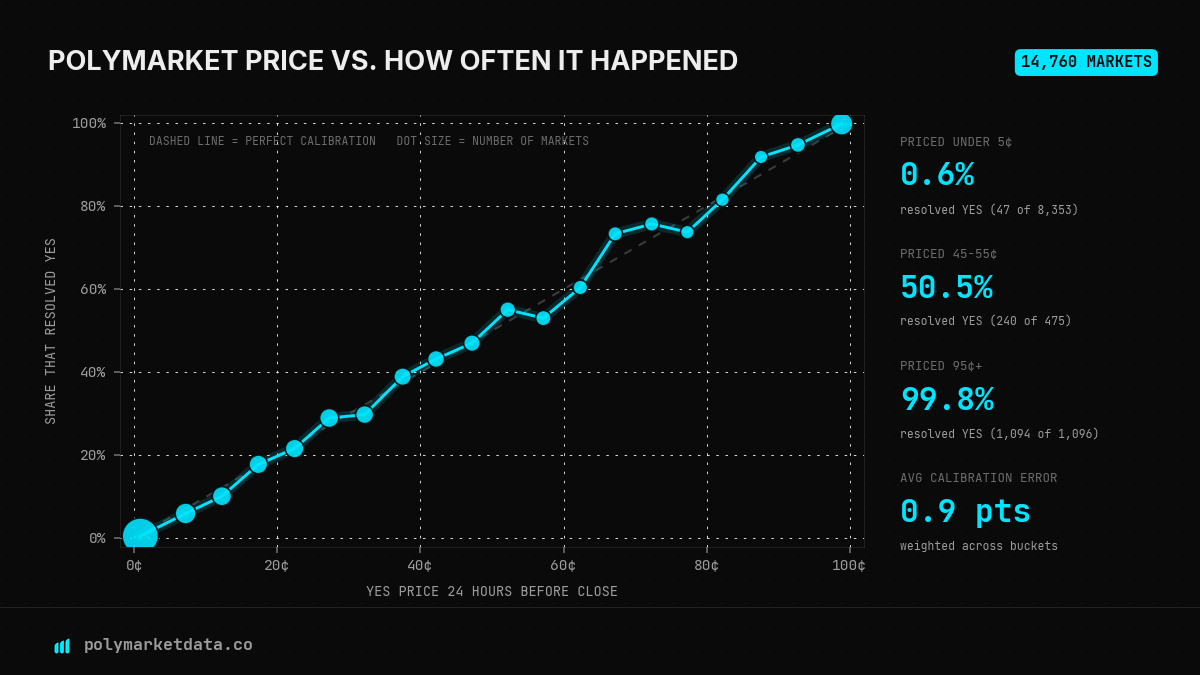
Each dot is a 5¢ price bucket, sized by the number of markets in it. The x-axis is the average Yes price 24 hours before close and the y-axis is the share of those markets that resolved Yes. 13 sampled weeks, September 2025 to September 2026, markets with a spread of 5¢ or less and at least $500 traded. Data: polymarketdata.co.
How accurate is Polymarket?
Of the 8,353 markets priced under 5¢ a day before close, 47 resolved Yes (0.6%, against an average price of 0.8¢). Of the 1,096 priced at 95¢ or higher, 1,094 resolved Yes. The 475 markets priced between 45¢ and 55¢ resolved Yes 50.5% of the time.
The middle of the range has fewer markets per bucket, so the dots there move around more. Even so, 18 of the 20 buckets land within two standard errors of the diagonal. The two outside that band are the two ends, under 5¢ and 95¢ or higher. In both, the expensive side won slightly more often than its price implied, the same direction as the longshot pattern further down.
The Brier score for the full set is 0.063. That's the average squared gap between price and outcome, where 0 is perfect. A forecaster who ignored prices and always predicted 20.2%, the overall Yes rate in the sample, would score 0.161.
Polymarket accuracy by category
The result holds within each category. We grouped markets by the tags on their parent event.
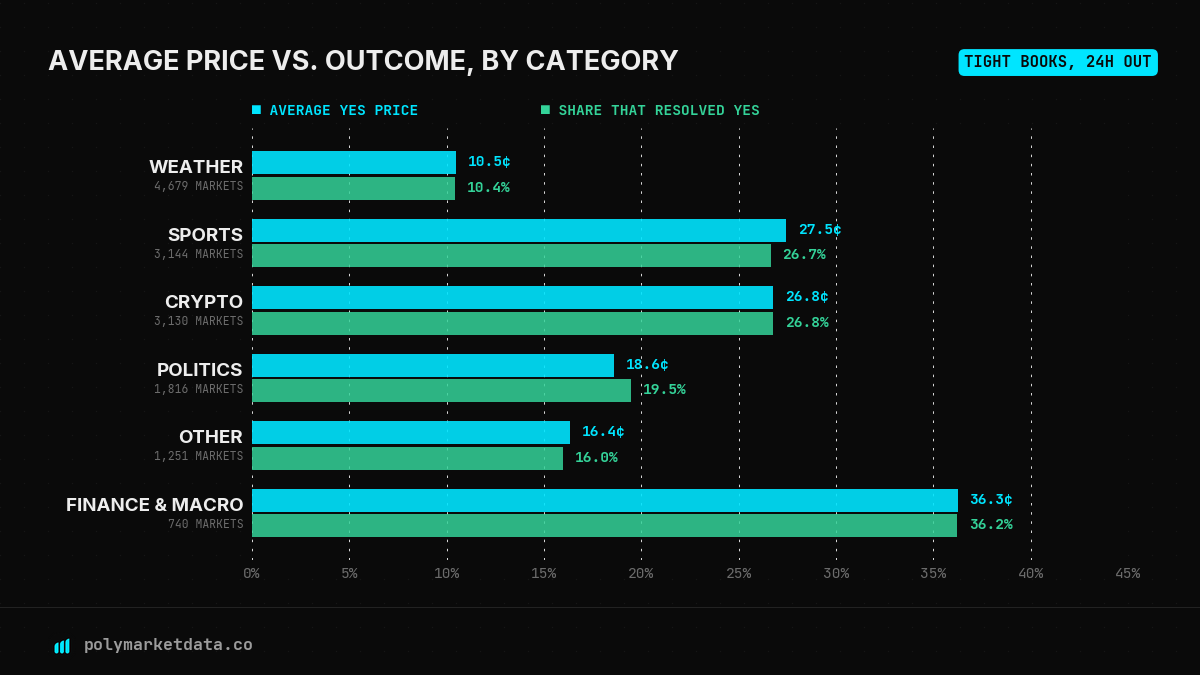
Average Yes price 24 hours before close (cyan) and the share of markets that resolved Yes (green), by category. Same sample and filters as above.
| Category | Markets | Avg Yes price | Resolved Yes | Brier score |
|---|---|---|---|---|
| Weather | 4,679 | 10.5¢ | 10.4% | 0.058 |
| Sports | 3,144 | 27.5¢ | 26.7% | 0.127 |
| Crypto | 3,130 | 26.8¢ | 26.8% | 0.040 |
| Politics | 1,816 | 18.6¢ | 19.5% | 0.045 |
| Other | 1,251 | 16.4¢ | 16.0% | 0.020 |
| Finance & macro | 740 | 36.3¢ | 36.2% | 0.039 |
The largest gap between average price and outcome is 0.9 points, in politics. Sports has the highest Brier score because a game the day before kickoff is closer to a coin flip than a temperature bracket or a crypto price level. The sports prices are still right on average: 27.5¢ against a 26.7% Yes rate across 3,144 markets. The markets the gambling argument is about are priced about as accurately as everything else on the platform.
Why Polymarket prices look wrong on thin order books
The filter we used matters a lot. A Polymarket price is derived from the order book. In a market with a 3¢ bid and a 97¢ ask, the price can sit near 50¢ even though nobody is willing to trade there. Plenty of markets look like that a day before they close, especially game markets that haven't drawn market makers yet.
To measure the effect we reran three of the weeks (10,344 markets) with no liquidity filter and split the markets by the state of their book 24 hours before close.
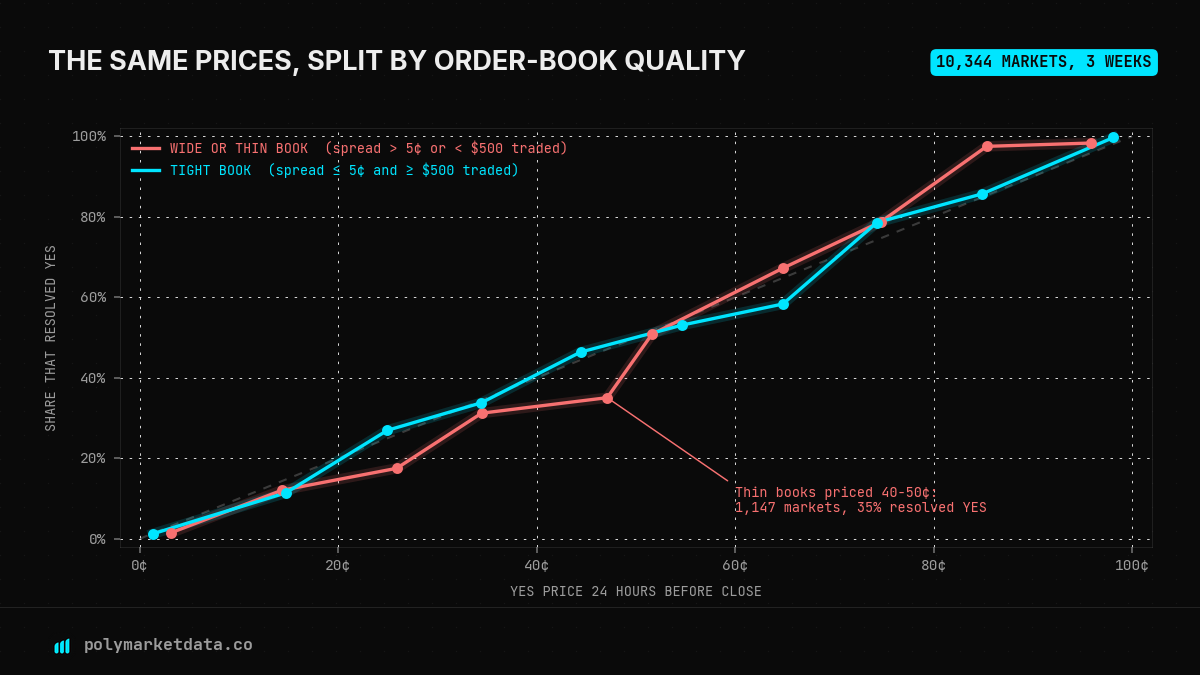
Markets closing in the weeks of Dec 8 2025, Apr 13 2026 and Jul 13 2026, in 10¢ buckets. Tight book: spread of 5¢ or less and at least $500 traded 24 hours before close. Everything else counts as wide or thin.
Markets with tight books had an average calibration error of 0.9 points and a Brier score of 0.066. Markets with wide or thin books had 4.7 points and 0.153. Most of the damage sits in the middle of the range. The 1,147 thin-book markets priced 40–50¢ a day out resolved Yes 35% of the time, and the 749 priced 20–30¢ resolved Yes 17.5% of the time.
This is an easy mistake to make in a Polymarket backtest. With a price series alone, you will conclude that Polymarket is badly miscalibrated around 50¢ and build a strategy that fades those prices. The spread and volume history for each market is what tells you which prices were backed by a real book. Our metrics endpoint returns both at one-minute resolution, next to the prices.
Is there an edge in Polymarket longshots?
Good average calibration still leaves room for small, persistent tilts. The one in this data is the favorite-longshot bias that sportsbooks and racetracks have shown for decades: cheap contracts win a bit less often than their price implies, and expensive ones a bit more often.
| Price 24h before close | Markets | Avg price | Resolved Yes | Gross return before costs |
|---|---|---|---|---|
| 5–15¢, buy No | 1,297 | 9.3¢ | 7.7% | +1.7% per trade |
| 85–95¢, buy Yes | 269 | 90.9¢ | 93.7% | +3.1% per trade |
Those returns assume you trade at the recorded price. Spreads in this sample run up to 5¢, which on a 91¢ contract is enough to erase most of the 3.1%. The favorites bucket also has only 269 markets. Treat both rows as a hypothesis to test against actual order-book fills, which our L2 slippage guide walks through step by step. The pattern also varies by market type. In our World Cup analysis, the regulation draw traded at 22¢ and hit 29% of the time, a longshot that was underpriced.
Run a Polymarket calibration check in Python
The script below repeats the test for any set of markets you choose. The API doesn't return a resolution field, so it reads the outcome from the settled Yes price after the market ends, and it uses each market's end_date as the reference time.
from datetime import timedelta
import pandas as pd
from polymarketdata import PolymarketDataClient, Resolution

HORIZON = timedelta(hours=24)

def snapshot(client, market):
    """Yes price, spread and volume 24h before end_date, plus the settled outcome."""
    if not market.end_date:
        return None
    end = pd.to_datetime(market.end_date, utc=True)
    start, stop = end - timedelta(days=3), end + timedelta(days=2)

    px = client.history.get_market_prices(
        market.slug, start_ts=start.isoformat(), end_ts=stop.isoformat(),
        resolution=Resolution.ONE_HOUR,
    ).to_dataframe_prices()
    px = px[px["label"] == "Yes"].assign(t=lambda d: pd.to_datetime(d["t"], utc=True)).set_index("t")["price"]

    mx = client.history.get_market_metrics(
        market.slug, start_ts=start.isoformat(), end_ts=stop.isoformat(),
        resolution=Resolution.ONE_HOUR,
    ).to_dataframe_metrics()
    mx = mx.assign(t=lambda d: pd.to_datetime(d["t"], utc=True)).set_index("t")

    before = px[: end - HORIZON]
    if before.empty or px[end:].empty:
        return None
    m_before = mx[: end - HORIZON]
    return {
        "slug": market.slug,
        "price": before.iloc[-1],
        "spread": m_before["spread"].iloc[-1] if not m_before.empty else None,
        "volume": m_before["volume"].iloc[-1] if not m_before.empty else None,
        "yes_won": int(px[end:].iloc[-1] >= 0.5),   # settled price is ~1 or ~0
    }

with PolymarketDataClient(api_key="YOUR_API_KEY") as client:
    markets = client.discovery.iter_markets(
        tags=["politics"],
        end_date_min="2026-06-01T00:00:00Z",
        end_date_max="2026-09-01T00:00:00Z",
    )
    rows = [r for m in markets if len(m.tokens) == 2 and (r := snapshot(client, m))]

df = pd.DataFrame(rows).dropna(subset=["spread", "volume"])
df = df[(df["spread"] <= 0.05) & (df["volume"] >= 500)]
df["bucket"] = (df["price"] * 10).clip(upper=9.99).astype(int) * 10

table = df.groupby("bucket").agg(markets=("yes_won", "size"),
                                 avg_price=("price", "mean"),
                                 yes_rate=("yes_won", "mean"))
print(table.round(3))
print("Brier:", round(((df["price"] - df["yes_won"]) ** 2).mean(), 4))
Each market takes two requests, one for prices and one for metrics. On the Pro plan (500 requests a minute) that works out to about 250 markets a minute. Free, Trader and Pro keys cover 30 to 90 days of history. The full-year study in this post needs Ultra, which has no history limit.
Method notes
- Sample: Yes/No markets that closed in the weeks starting Sep 15, Oct 13, Nov 10 and Dec 8 2025, and Jan 12, Feb 9, Mar 9, Apr 13, May 11, Jun 15, Jul 13, Aug 24 and Sep 14 2026. Weeks in 2025 use every market. The 2026 weeks use a random hash-based sample of 20% to 50% of market IDs.
- Price: the last Yes price at or before 24 hours ahead of the recorded close time. Markets with no price update in the six hours before that point were dropped.
- Liquidity filter: spread of 5¢ or less and cumulative volume of at least $500 at the same timestamp.
- Categories come from event tags, checked in this order: sports, crypto, weather, politics, finance. Markets inside multi-outcome events count once each.
- Outcome: the resolved token recorded for the market.
Get an API key at polymarketdata.co and run the script on the category you trade.
All data from the polymarketdata.co API. Full endpoint reference at polymarketdata.co/docs.