Polymarket's Bitcoin Forward Curve Called March Right — And the Rally Was Borrowed Time
How Polymarket's binary touch options on Bitcoin's March price range implied a 90% dip risk to $65K and 39% upside to $75K on Day 1 — and why the market knew the rally would stall.
On March 1, 2026, if you wanted to know where Bitcoin was headed that month, you could have read the analyst reports. Or you could have looked at Polymarket's binary touch options, which told a more precise and ultimately correct story: a 90.2% probability that BTC would dip to $65K at some point in March, alongside a 38.6% probability it would touch $75K — with near-zero chance of anything above $85K.
By March 31, BTC had done both: rallied 12% to touch $75K on March 16–17, then retreated toward the $64–67K zone where it closed the month. The crowd got the range right. But what makes this interesting from a data perspective isn't the prediction itself — it's how the probability structure encoded the bearish skew in the rally from the very first day.
The Forward Probability Curve
When Polymarket lists a series of binary markets — "Will Bitcoin reach $70K in March?", "$75K?", "$80K?" and so on down to "$65K dip?", "$60K dip?" — you can treat each Yes token price as an implied touch-barrier option. The price of "Will BTC reach $75K?" is the market's estimate of the probability that BTC trades at or above $75K at any point during the month.
Differencing these curves gives you something close to an implied probability density: the crowd's consensus on where Bitcoin's range will be. This is the forward probability curve, and March 2026 had a particularly clean one to analyze.
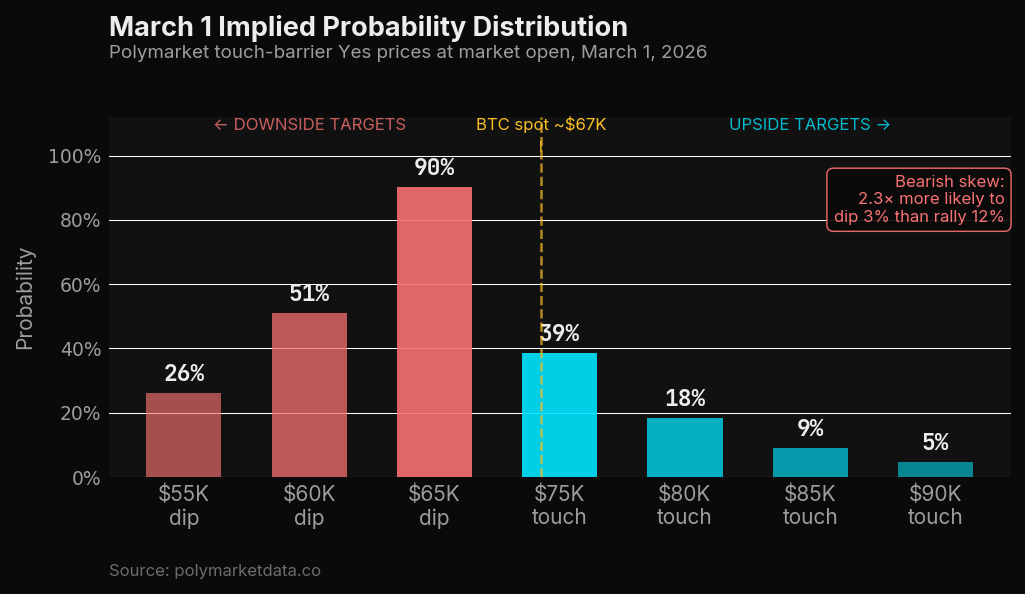
At open on March 1 with BTC around $67K, the implied distribution was striking:
| Strike | Direction | Probability |
|---|---|---|
| $55K | Dip | 26.0% |
| $60K | Dip | 51.1% |
| $65K | Dip | 90.2% |
| $75K | Touch | 38.6% |
| $80K | Touch | 18.3% |
| $85K | Touch | 8.9% |
| $90K | Touch | 4.6% |
The bearish skew is immediately visible. The crowd was assigning 90% probability to a $65K touch (2.9% below spot) and only 38.6% probability to a $75K touch (12% above spot). In risk-reversal terms, that's an enormous premium on downside outcomes relative to the distance of the strikes. Roughly put: the crowd thought BTC was 2.3× more likely to dip 3% than to rally 12%.
Whether this reflects macro fear, elevated realized volatility, or the market-making cost structure for these touch-barriers is worth a separate post. But the forward curve was unambiguous: this was a bearish-skewed distribution despite BTC trading near the middle of its range.
Two Attempts, One Touch
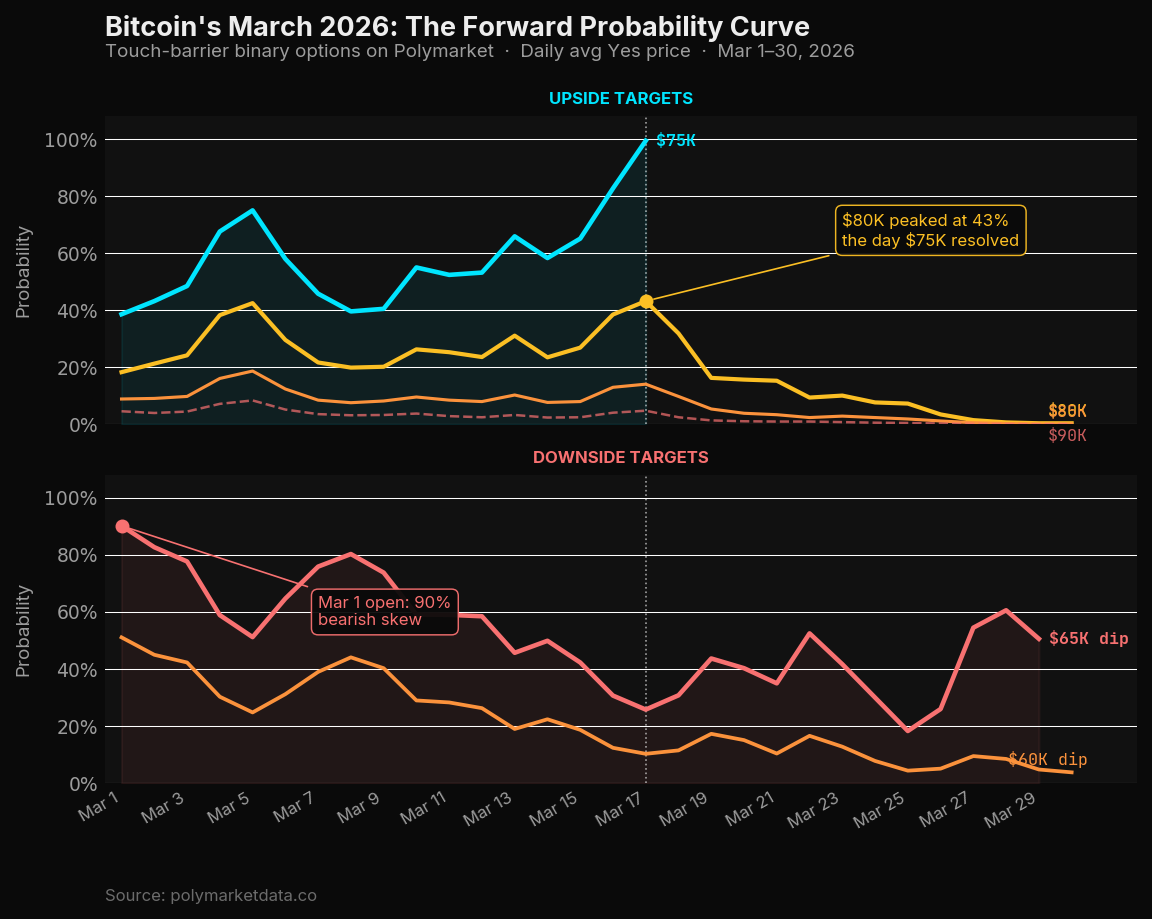
The probability evolution over March played out in two distinct phases, both visible in the touch-option prices.
Phase 1: The failed rally (March 1–9). BTC moved off $67K in the first week, pushing the $75K probability from 38.6% up to 75% by end of day March 5. The $65K dip probability fell in tandem — from 90% to 51%. For a few days it looked like BTC might clear $75K on the first attempt. Then it faded. By March 8–9, the $75K probability was back below 40%, and the $65K dip probability had surged to 80%. The first attempt had failed and BTC was flirting with the low $60Ks again.
Phase 2: The successful rally (March 10–17). The second attempt was more deliberate. The $75K market climbed from 52% on March 10 to 65% on March 15, 82.7% on March 16, and 99.4% on March 17 — the day BTC finally touched $75K. The market resolved. The ceiling was cleared.
But look at the $80K curve during this run. On March 17, the day BTC touched $75K and the crowd was maximally bullish, $80K reached only 43% — its peak for the entire month. The market was telling you: this is a touch, not a breakout. The $85K and $90K curves barely moved, never exceeding 14% and 5% respectively. The forward book was already pricing in a reversal.
Phase 3: The retreat (March 18–31). After $75K resolved, the structure collapsed quickly. $80K probability fell from 43% to 16% within three days of the $75K touch. By March 25 it was under 7.5%. By March 29, under half a percent. Meanwhile, the $65K dip market — which had collapsed to 26% at the $75K peak — surged back above 60% by late March as BTC gave back its gains. By the last trading day, $80K was dead at 0.05 cents. The $65K dip market resolved with BTC testing that level.
Spread Dynamics as a Microstructure Signal
The bid-ask spread on these markets is a direct measure of market-maker uncertainty. Wide spread = they're unsure of the fair value and charging for it. Tight spread = the market is liquid, the price is well-established.
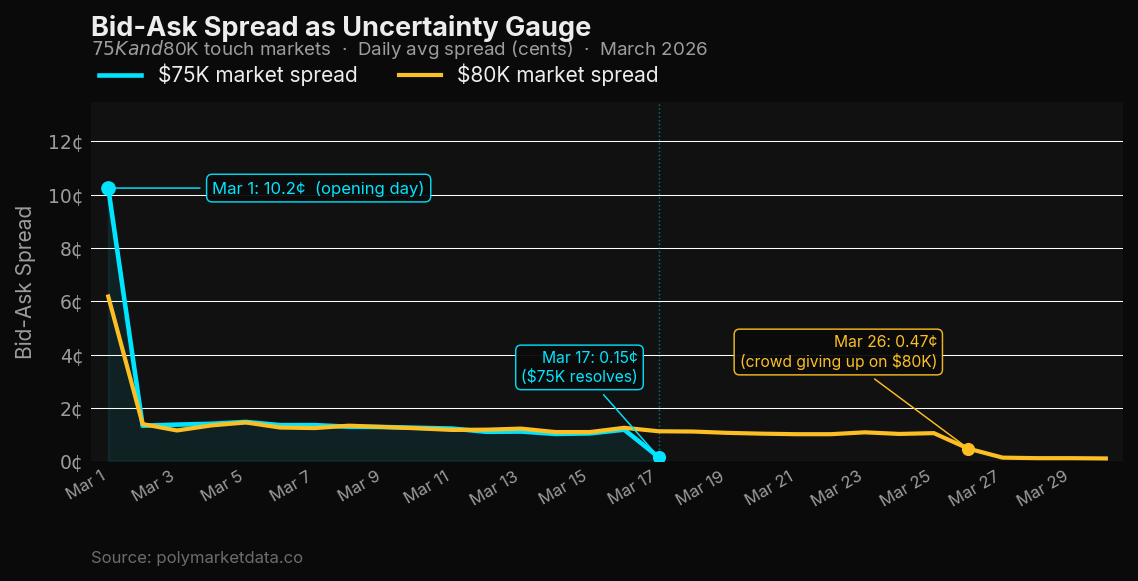
The March 1 spread on the $75K market was 10.2 cents — an enormous uncertainty premium for a binary contract with a maximum payout of 100 cents. That 10-cent spread reflects the fact that no one had strong edge on whether BTC would clear $75K that month when it opened at $67K.
By March 12, the spread had compressed to 1.1 cents. Liquidity had deepened, the market was establishing a price. On March 17, the day of resolution, the spread collapsed to 0.15 cents — the market-makers had essentially no uncertainty left; they were just facilitating order flow around a known outcome.
The $80K spread tells a different story. It stayed tight through the rally (1.0–1.5 cents), then began compressing in the final week not because the market was resolving YES, but because it was effectively dead. A 0.35% probability doesn't need much spread to be efficient — there's no information left to price.
Reconstructing the Curve With the API
You can pull this data yourself and build the same analysis for April's price markets. The pattern is already starting: with BTC around $62–64K as April opens, the April touch-barrier markets are live and the forward curve is forming.
import os
import pandas as pd
import numpy as np
from polymarketdata import PolymarketDataClient, Resolution
from datetime import datetime, timezone

client = PolymarketDataClient(api_key=os.environ["POLYMARKETDATA_API_KEY"])

# Pull price history for a set of touch-barrier markets
MARKET_SLUGS = {
    "will-bitcoin-reach-75k-in-march-2026": ("upside", 75_000),
    "will-bitcoin-reach-80k-in-march-2026": ("upside", 80_000),
    "will-bitcoin-reach-85k-in-march-2026": ("upside", 85_000),
    "will-bitcoin-reach-90k-in-march-2026": ("upside", 90_000),
    "will-bitcoin-dip-to-65k-in-march-2026": ("downside", 65_000),
    "will-bitcoin-dip-to-60k-in-march-2026": ("downside", 60_000),
}

frames = []
for slug, (direction, strike) in MARKET_SLUGS.items():
    prices = client.history.get_market_prices(
        slug,
        start_ts="2026-03-01T00:00:00Z",
        end_ts="2026-03-31T23:59:00Z",
        resolution=Resolution.ONE_HOUR,
    )
    df = prices.to_dataframe_prices()
    # Keep only the 'Yes' token
    df = df[df["label"] == "Yes"].copy()
    df["strike"] = strike
    df["direction"] = direction
    df["slug"] = slug
    frames.append(df)

all_prices = pd.concat(frames)
all_prices["date"] = pd.to_datetime(all_prices["t"]).dt.date

# Daily average probability per strike
daily = (
    all_prices
    .groupby(["date", "strike", "direction"])["price"]
    .mean()
    .reset_index()
    .rename(columns={"price": "prob"})
)

# Snapshot on a specific date — e.g. March 1
snapshot = daily[daily["date"] == datetime(2026, 3, 1).date()].sort_values("strike")
print(snapshot.to_string(index=False))
       date   strike  direction    prob
 2026-03-01    60000  downside   0.5109
 2026-03-01    65000  downside   0.9019
 2026-03-01    75000  upside     0.3861
 2026-03-01    80000  upside     0.1829
 2026-03-01    85000  upside     0.0891
 2026-03-01    90000  upside     0.0461
To reconstruct the implied probability density between strikes (i.e., the probability that Bitcoin's
monthly high lands in a specific range rather than just touching a level), you can difference
the touch probabilities. For upside targets, P(reach $80K) - P(reach $85K) gives you the implied
probability that the high lands between $80K and $85K. For downside, the analogous difference
gives the probability that the low lands in each bucket.
# Implied PDF from differences (upside example)
upside = daily[
    (daily["direction"] == "upside") &
    (daily["date"] == datetime(2026, 3, 1).date())
].sort_values("strike", ascending=False)

upside["bucket_prob"] = upside["prob"].diff(-1).fillna(upside["prob"].iloc[-1])
upside["label"] = upside["strike"].apply(lambda s: f"High in ${s//1000}K–${(s+5000)//1000}K")
print(upside[["label", "prob", "bucket_prob"]].to_string(index=False))
              label    prob  bucket_prob
 High in $90K–$95K   0.046        0.046
 High in $85K–$90K   0.089        0.043
 High in $80K–$85K   0.183        0.094
 High in $75K–$80K   0.386        0.203
 High above $90K     0.046        0.046
The implied probability that Bitcoin's March high would land between $75K and $80K was 20.3% on March 1. That's exactly what happened — BTC touched $75K and stalled there. The forward curve was pricing the right outcome; traders just had to decide whether to fade it or follow it.
The Trading Implication
The most actionable signal from this framework isn't predicting direction — it's measuring conviction quality. When BTC touched $75K on March 17, the $80K market peaked at 43%. That's a meaningful ceiling: the crowd had absorbed the $75K news and its updated best guess was roughly a coin flip on $80K. But by March 19 — two days later — $80K was already at 16%. The crowd wasn't anchoring at 43%; they were immediately discounting the rally.
Contrast that with the failed first attempt in early March: the $75K probability hit 75%, but the $80K probability peaked at 42.5% — nearly the same level as at the successful touch. From a forward-curve perspective, the market assigned nearly identical breakout conviction to both attempts. The difference was that in March's first week, BTC turned around; in the second, it didn't.
The lesson is that the forward curve alone doesn't tell you which attempt succeeds. But it does tell you how far the crowd thinks a breakout will go, and in March 2026, the answer was clear: $75K and not much further. The $80K ceiling was priced in from the day the market opened.
The April structure is forming now. With BTC around $62–64K and the same touch-barrier series running for April, the March pattern gives you a template for what to watch: the shape of the probability curve at month-open, how it evolves on the first directional attempt, and what the spread dynamics tell you about market-maker conviction heading into a potential resolution.
All data pulled from the polymarketdata.co API using the
polymarketdata-sdk. Full endpoint reference at polymarketdata.co/docs.